
World Market Indices
The Market Indices page provides a comprehensive view of global stock market indices with real-time performance data, regional analytics, and interactive visualizations.
Dashboard Overview
The indices dashboard features:
- Indigo/purple gradient header with analytics theming
- Analytics summary cards showing totals and market sentiment
- Top movers sections highlighting gainers and losers
- Regional coverage with geographic distribution
- Interactive tabbed interface for different views
Key Features
📊 Summary Analytics
| Metric | Description |
|---|---|
| Total Indices | Complete count of all tracked indices |
| Major Indices | Flagship indices (S&P 500, Dow Jones, NASDAQ, etc.) |
| Market Sentiment | Overall market direction (bullish/bearish/neutral) |
| Average Change | Mean percentage change across all indices |
📈 Top Movers
Top Gainers:
- Indices with highest positive percentage changes
- Ranked display with country information
- Real-time performance tracking
Top Losers:
- Indices with largest negative percentage changes
- Quick identification of underperforming markets
- Regional context for analysis
Regional Coverage
The dashboard tracks indices across major regions:
| Region | Coverage |
|---|---|
| 🌎 North America | S&P 500, Dow Jones, NASDAQ, TSX |
| 🌍 Europe | FTSE 100, DAX, CAC 40, Euro Stoxx |
| 🌏 Asia | Nikkei 225, Hang Seng, Shanghai Composite |
| 🌏 Oceania | ASX 200, NZX 50 |
| 🌍 Emerging | Bovespa, SENSEX, JSE |
Interactive Components
📋 World Indices Grid
Comprehensive data grid featuring:
- Real-time index values
- Daily change (absolute and percentage)
- Country and exchange information
- Sortable and filterable columns
- Export capabilities
🗺️ Global Map
Geographic visualization showing:
- Bubble markers for each index
- Size proportional to market cap or performance
- Color-coded by daily change
- Interactive hover details
- Regional zoom capabilities
📄 Asset Details
Detailed asset information including:
- Full index specifications
- Exchange and ticker symbols
- Historical data access
- Related indices
Major Indices Tracked
| Index | Country | Exchange |
|---|---|---|
| S&P 500 | USA | NYSE |
| Dow Jones | USA | NYSE |
| NASDAQ Composite | USA | NASDAQ |
| FTSE 100 | UK | LSE |
| DAX | Germany | XETRA |
| CAC 40 | France | Euronext |
| Nikkei 225 | Japan | TSE |
| Hang Seng | Hong Kong | HKEX |
| Shanghai Composite | China | SSE |
| ASX 200 | Australia | ASX |
Data Sources
- Real-time Quotes: Live market data with regular updates
- Historical Data: Historical price and volume information
- Geographic Data: Country and regional classifications
- Internal Database: Index metadata and relationships
Technical Implementation
Technology Stack
| Component | Technology |
|---|---|
| Frontend | Angular 18 with Infragistics UI |
| Data Grid | IgxGrid with real-time updates |
| Map | Infragistics Geographic Map |
| Styling | SCSS with indigo/purple theme |
UI Components Used
IgxCardModule- Dashboard cardsIgxTabsModule- Tabbed navigationIgxListModule- Top movers listsIgxChipsModule- Regional badgesIgxIconModule- Material iconsGeographic Map- World visualization
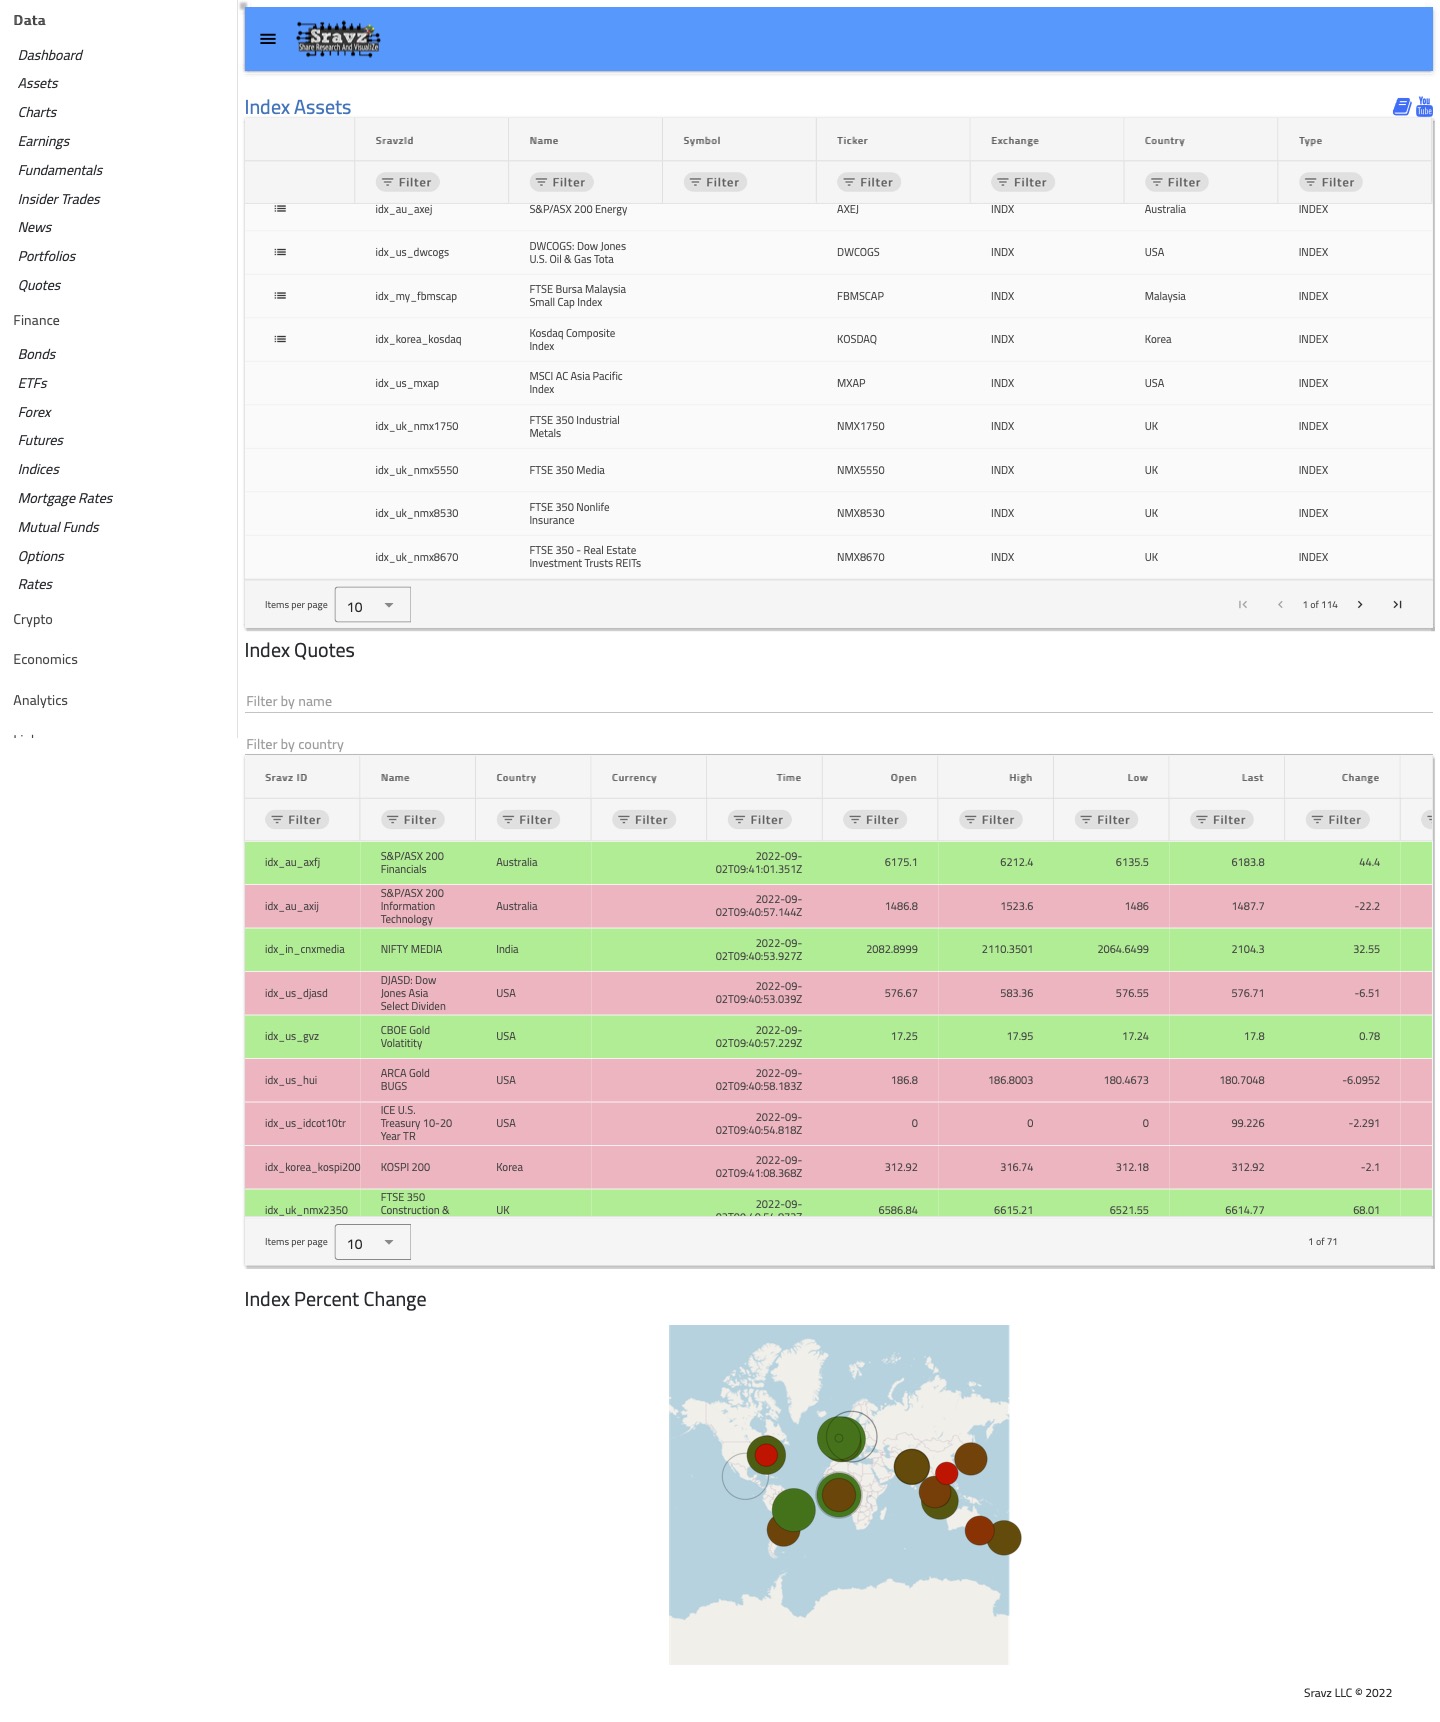
Screenshot
Related Pages
- Quotes Dashboard - Stock quotes and market data
- ETF Analytics - Exchange-Traded Funds
- Bond Analytics - Bond market data
- Forex Assets - Currency exchange rates