Futures Statistics Dashboard
Visit Sravz Futures Page
Futures Video Explanation
Overview
The Futures Statistics Dashboard provides comprehensive analysis of futures contracts performance. It helps investors identify which futures are trading at a discount or premium relative to their historical price ranges, enabling better investment decisions.
Use Case
Use this dashboard to:
- Identify Discounted Futures: Find futures priced below their historical averages for potential buying opportunities
- Spot Overvalued Contracts: Identify futures trading near their historical highs
- Analyze Volatility: Compare standard deviations to assess risk across different contracts
- Track Market Sentiment: Quickly gauge bullish vs bearish positioning across the futures market
Dashboard Features
1. Summary Cards
At-a-glance market sentiment indicators:
| Card | Description |
|---|---|
| Bullish | Count of contracts trading above their 75th percentile (strong performers) |
| Neutral | Count of contracts trading between 25th-75th percentile (average performers) |
| Bearish | Count of contracts trading below their 25th percentile (underperformers) |
| Total | Total number of futures contracts being tracked |
2. Interactive Charts (Tabbed View)
Price vs Percentiles Chart
- Visualizes each contract’s current price position relative to Min, Mean, and Max
- Selectable chart types: Column, Line, Area, Spline, Waterfall, and more
- Zoom and pan capabilities for detailed analysis
Market Distribution (Pie Chart)
- Shows the overall market sentiment distribution
- Segments: Bullish (>75%), Neutral (25-75%), Bearish (<25%)
Volatility Analysis
- Column chart displaying standard deviation by contract
- Helps identify high-risk vs low-risk futures
Price Range Comparison
- Line chart comparing Min, Max, Mean, and Current prices
- Useful for spotting contracts at extremes of their historical range
Percentile Breakdown
- Area chart showing 25th, 50th, and 75th percentile distributions
- Visualizes the spread of historical price levels
3. Top Movers Section
Three ranking cards highlighting notable contracts:
| Section | Description |
|---|---|
| Top 5 Bullish | Contracts with highest % vs Max (closest to all-time highs) |
| Top 5 Bearish | Contracts with lowest % vs Min (closest to all-time lows) |
| Most Volatile | Contracts with highest standard deviation (highest risk/reward) |
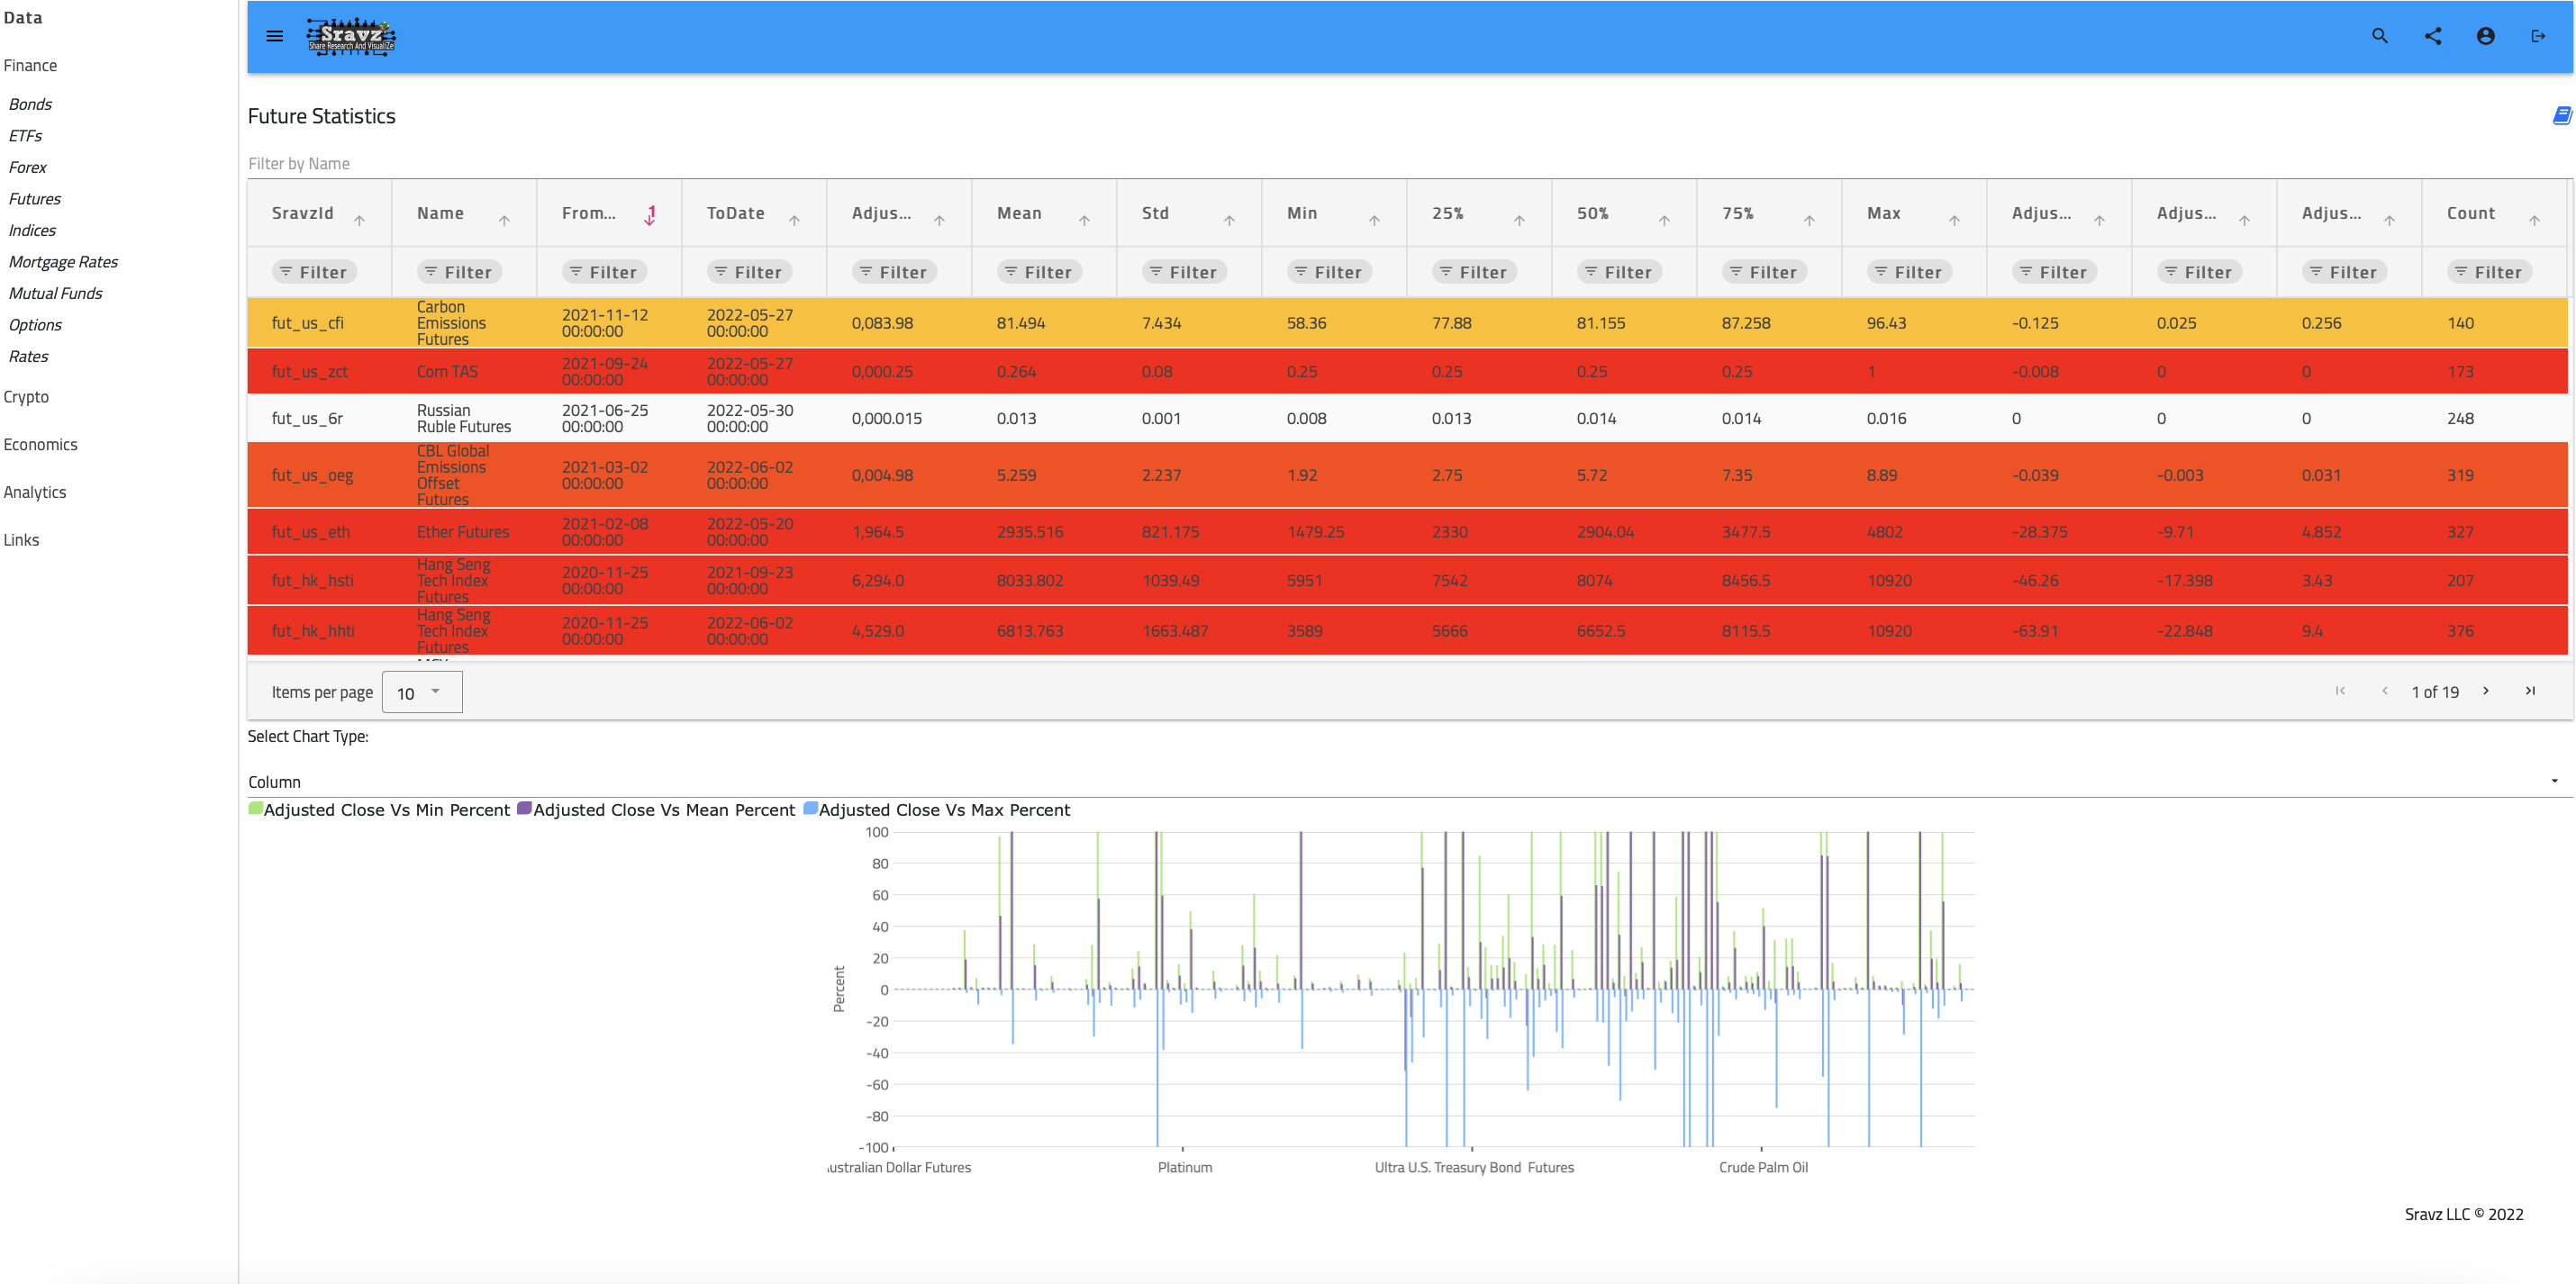
4. Detailed Data Grid
Expandable data table with full statistics:
- Filterable and sortable columns
- Color-coded rows based on price position
- Export capabilities
Data Points Explained
Futures Price Statistics
| Field | Description |
|---|---|
| SravzId | Sravz Assets Identification Number |
| Name | Future contract name |
| FromDate | Historical data start date |
| ToDate | Historical data end date |
| AdjustedClose | Current adjusted closing price |
| Mean | Historical mean (average) price |
| Std | Standard deviation (volatility measure) |
| Min | Historical minimum price |
| 25% | 25th percentile price |
| 50% | 50th percentile (median) price |
| 75% | 75th percentile price |
| Max | Historical maximum price |
| AdjustedCloseVsMaxPercent | Current price as % deviation from Max |
| AdjustedCloseVsMeanPercent | Current price as % deviation from Mean |
| AdjustedCloseVsMinPercent | Current price as % deviation from Min |
Color Coding System
The data grid uses color coding to quickly identify price positions:
| Color | Condition | Interpretation |
|---|---|---|
| 🟢 Green/White | AdjustedClose > 75% percentile | Trading near highs |
| 🟡 Amber | AdjustedClose between 50-75% | Moderately priced |
| 🟠 Orange | AdjustedClose between 25-50% | Below average |
| 🔴 Red | AdjustedClose < 25% percentile | Trading near lows (potential opportunity) |
How to Use This Dashboard
- Quick Assessment: Check the summary cards for overall market sentiment
- Deep Dive: Use the tabbed charts to analyze specific metrics
- Find Opportunities: Review the Top Movers section for extreme cases
- Research: Expand the data grid for detailed contract-by-contract analysis
- Export: Download data for further analysis in spreadsheets
Sravz Analytics Futures Page
Visit Sravz Futures Page for the full interactive experience.
Screenshot