
Earnings Analytics Dashboard
Track quarterly earnings reports with comprehensive beat/miss analysis and surprise trends for stocks worldwide.
Dashboard Overview
The Earnings page provides a powerful analytics dashboard for monitoring corporate earnings announcements, comparing actual results against analyst estimates, and identifying investment opportunities.
Summary Statistics
Four key performance metrics are displayed at the top:
| Metric | Description |
|---|---|
| Total Reports | Complete count of earnings reports tracked |
| Beats | Number of companies that exceeded analyst estimates (green) |
| Misses | Number of companies that fell below estimates (red) |
| Avg Surprise | Mean percentage deviation from estimates |
Each card includes a progress bar showing the relative percentage.
Latest Earnings Tab
Quick Time Filters
Filter earnings reports by time period using the button group:
- Today - Earnings reported today
- Tomorrow - Upcoming earnings for tomorrow
- Yesterday - Previous day’s reports
- Week - All earnings for the current week
Country Filter
Auto-complete dropdown to filter by country code (US, UK, DE, etc.)
Top Performers Section
Two side-by-side cards highlight:
Top Earnings Beats
Shows the 5 stocks with the highest positive surprise percentage:
- Ranked 1-5 with medal-style avatars (gold, silver, bronze)
- Ticker symbol and country
- Green chip showing positive surprise percentage
Biggest Earnings Misses
Shows the 5 stocks with the largest negative surprise:
- Ranked list with warning indicators
- Red chip showing negative surprise percentage
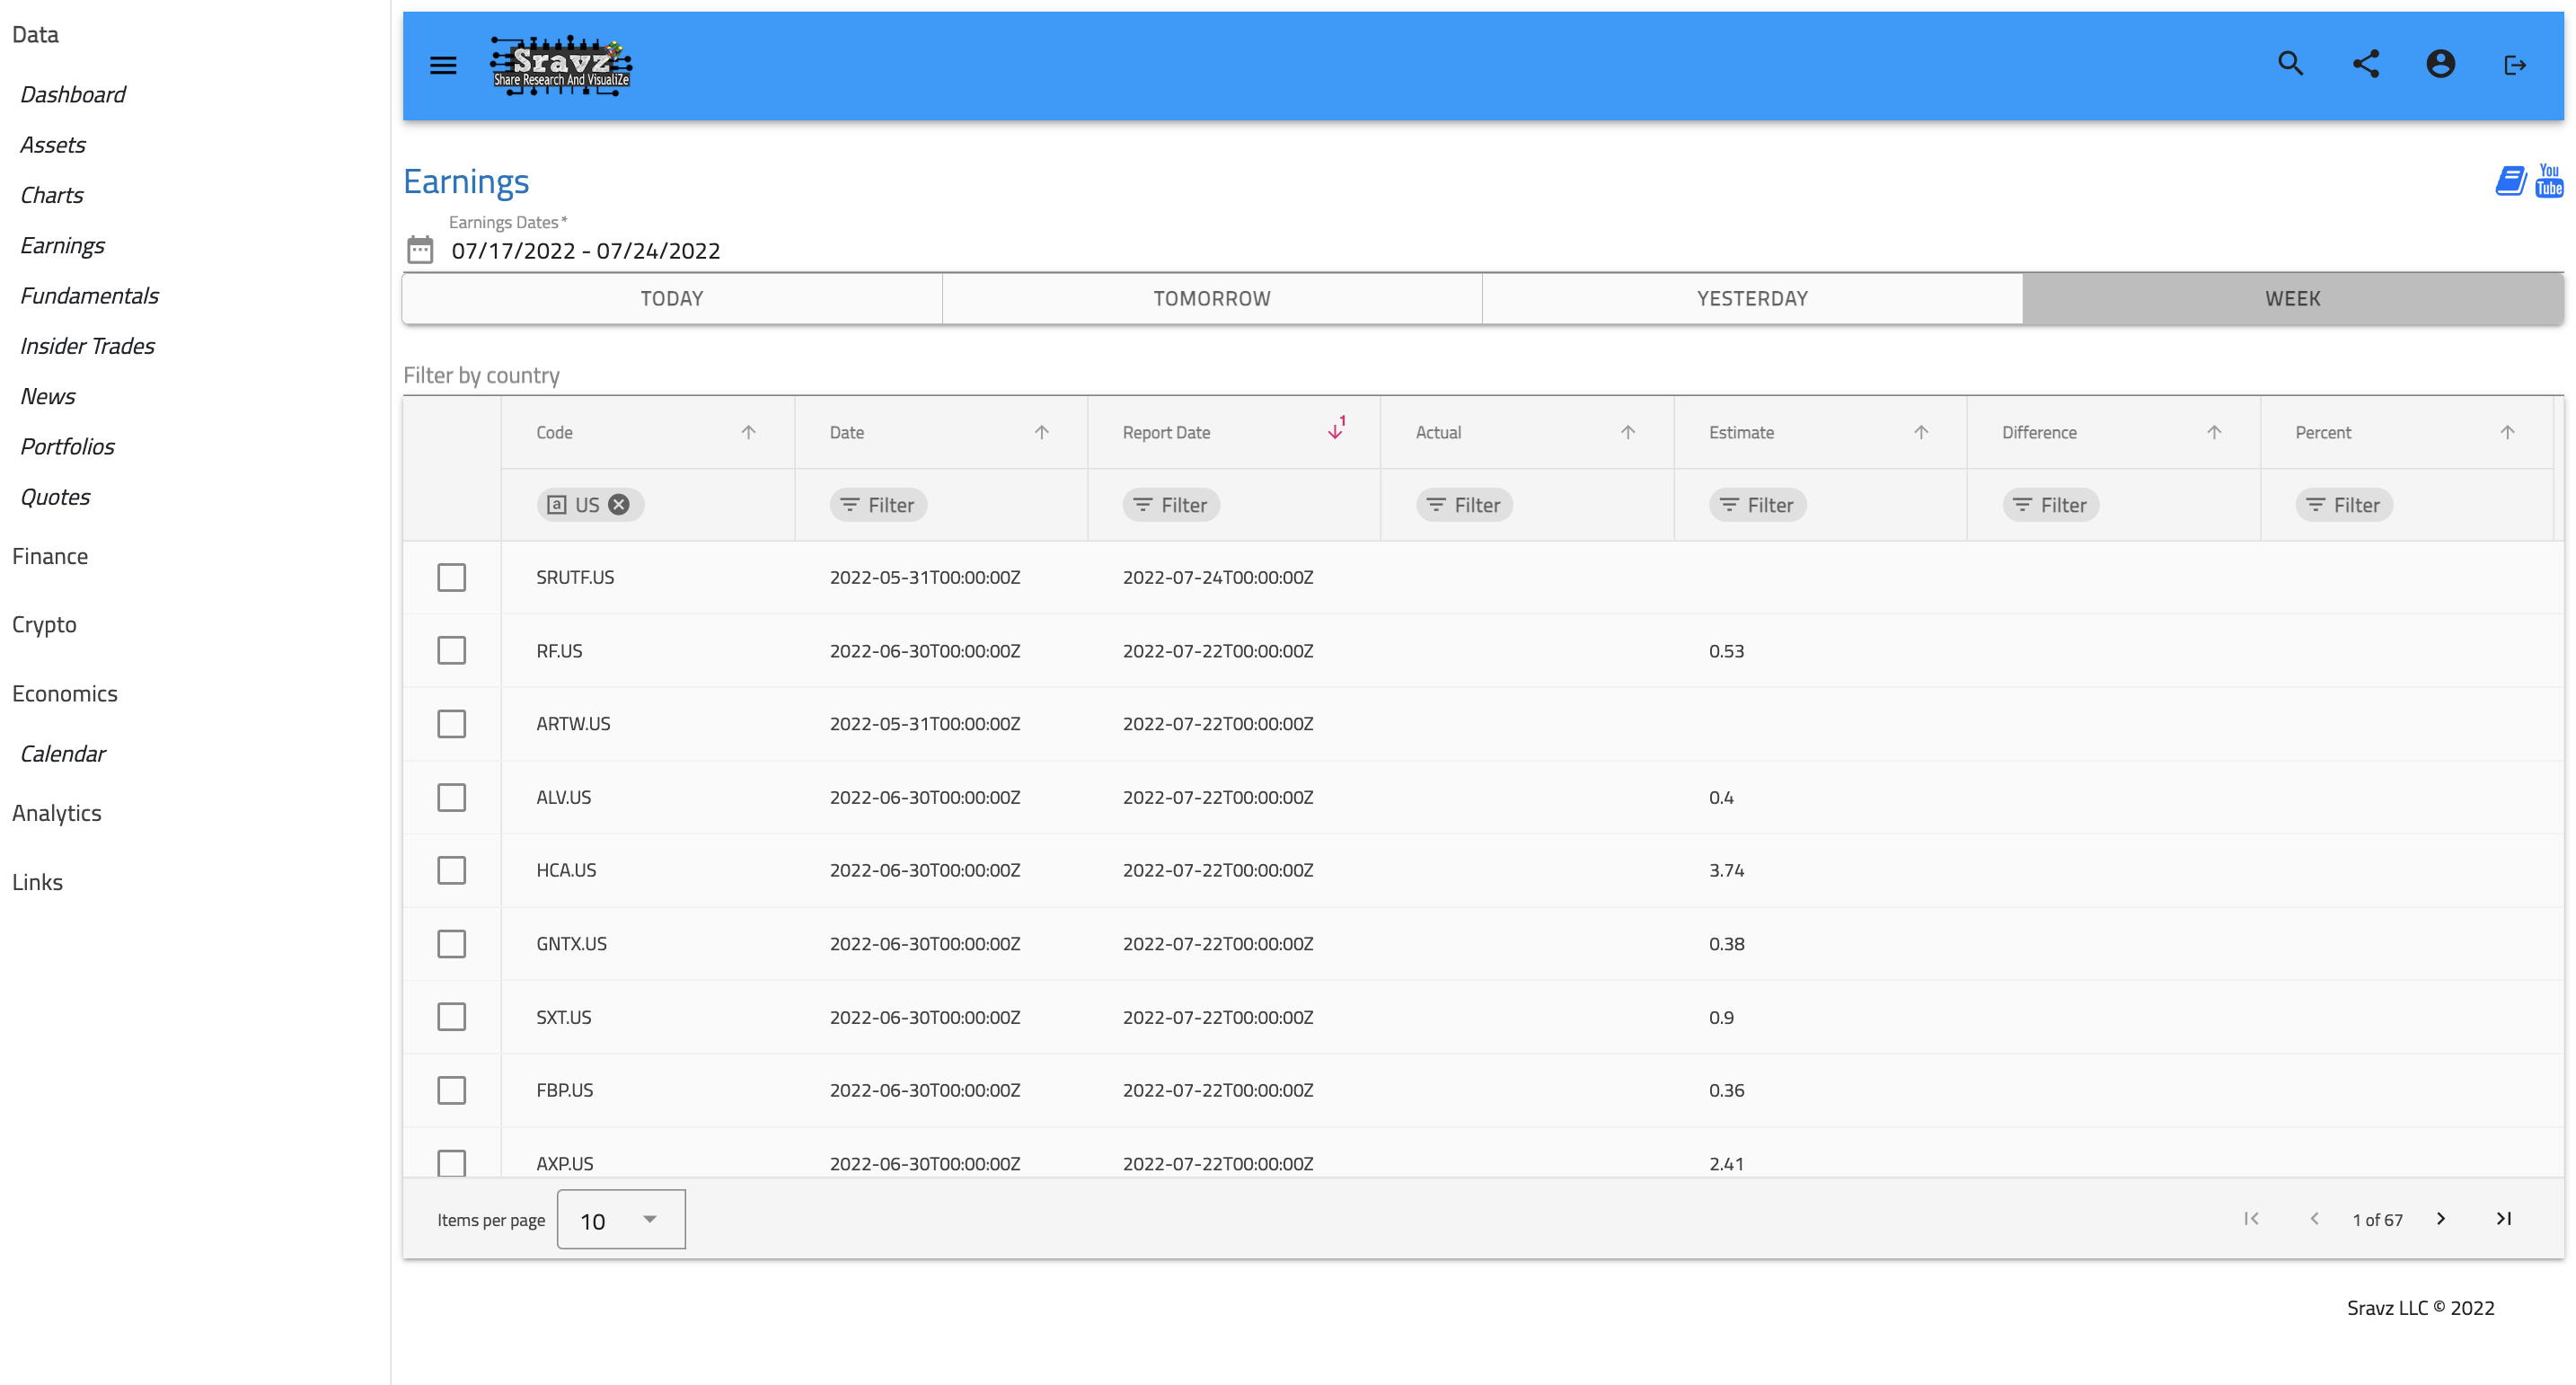
Enhanced Data Grid
The earnings grid displays:
| Column | Description |
|---|---|
| Stock | Ticker chip with country badge |
| Report Date | Date of earnings release |
| Actual EPS | Reported earnings per share (color-coded) |
| Estimate | Analyst consensus estimate |
| Surprise | Difference chip with trend icon (↑/↓/→) |
| % Surprise | Badge showing percentage beat/miss |
Visual Indicators:
- 🟢 Green chips/badges for beats
- 🔴 Red chips/badges for misses
- ⚪ Gray for met expectations
- “Pending” for upcoming reports
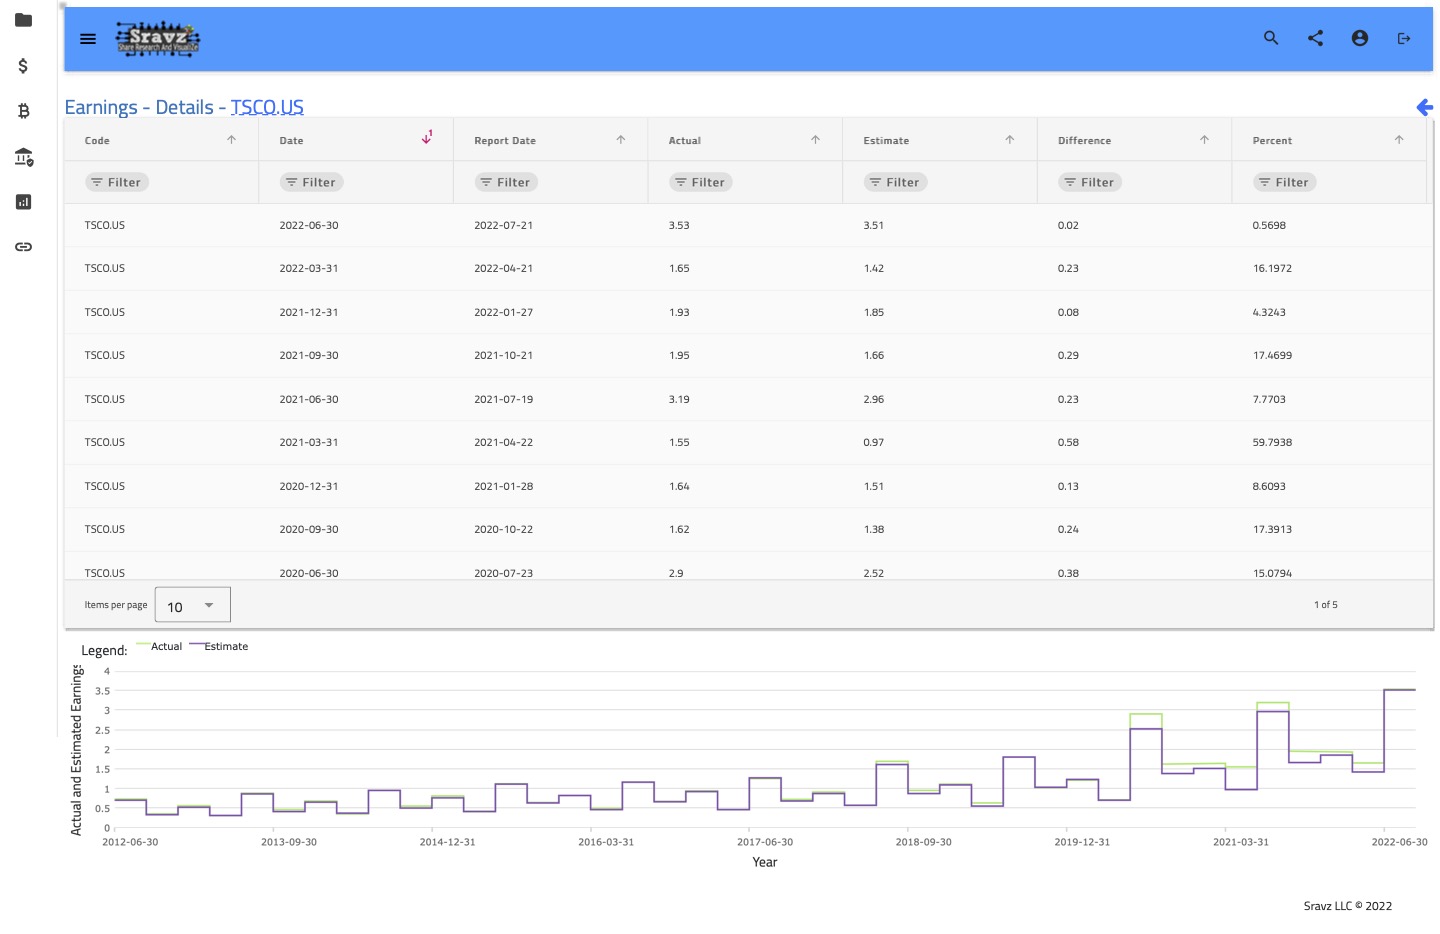
Grid Features:
- Click any row to view detailed historical earnings
- Column sorting and filtering
- Pagination (10 items per page)
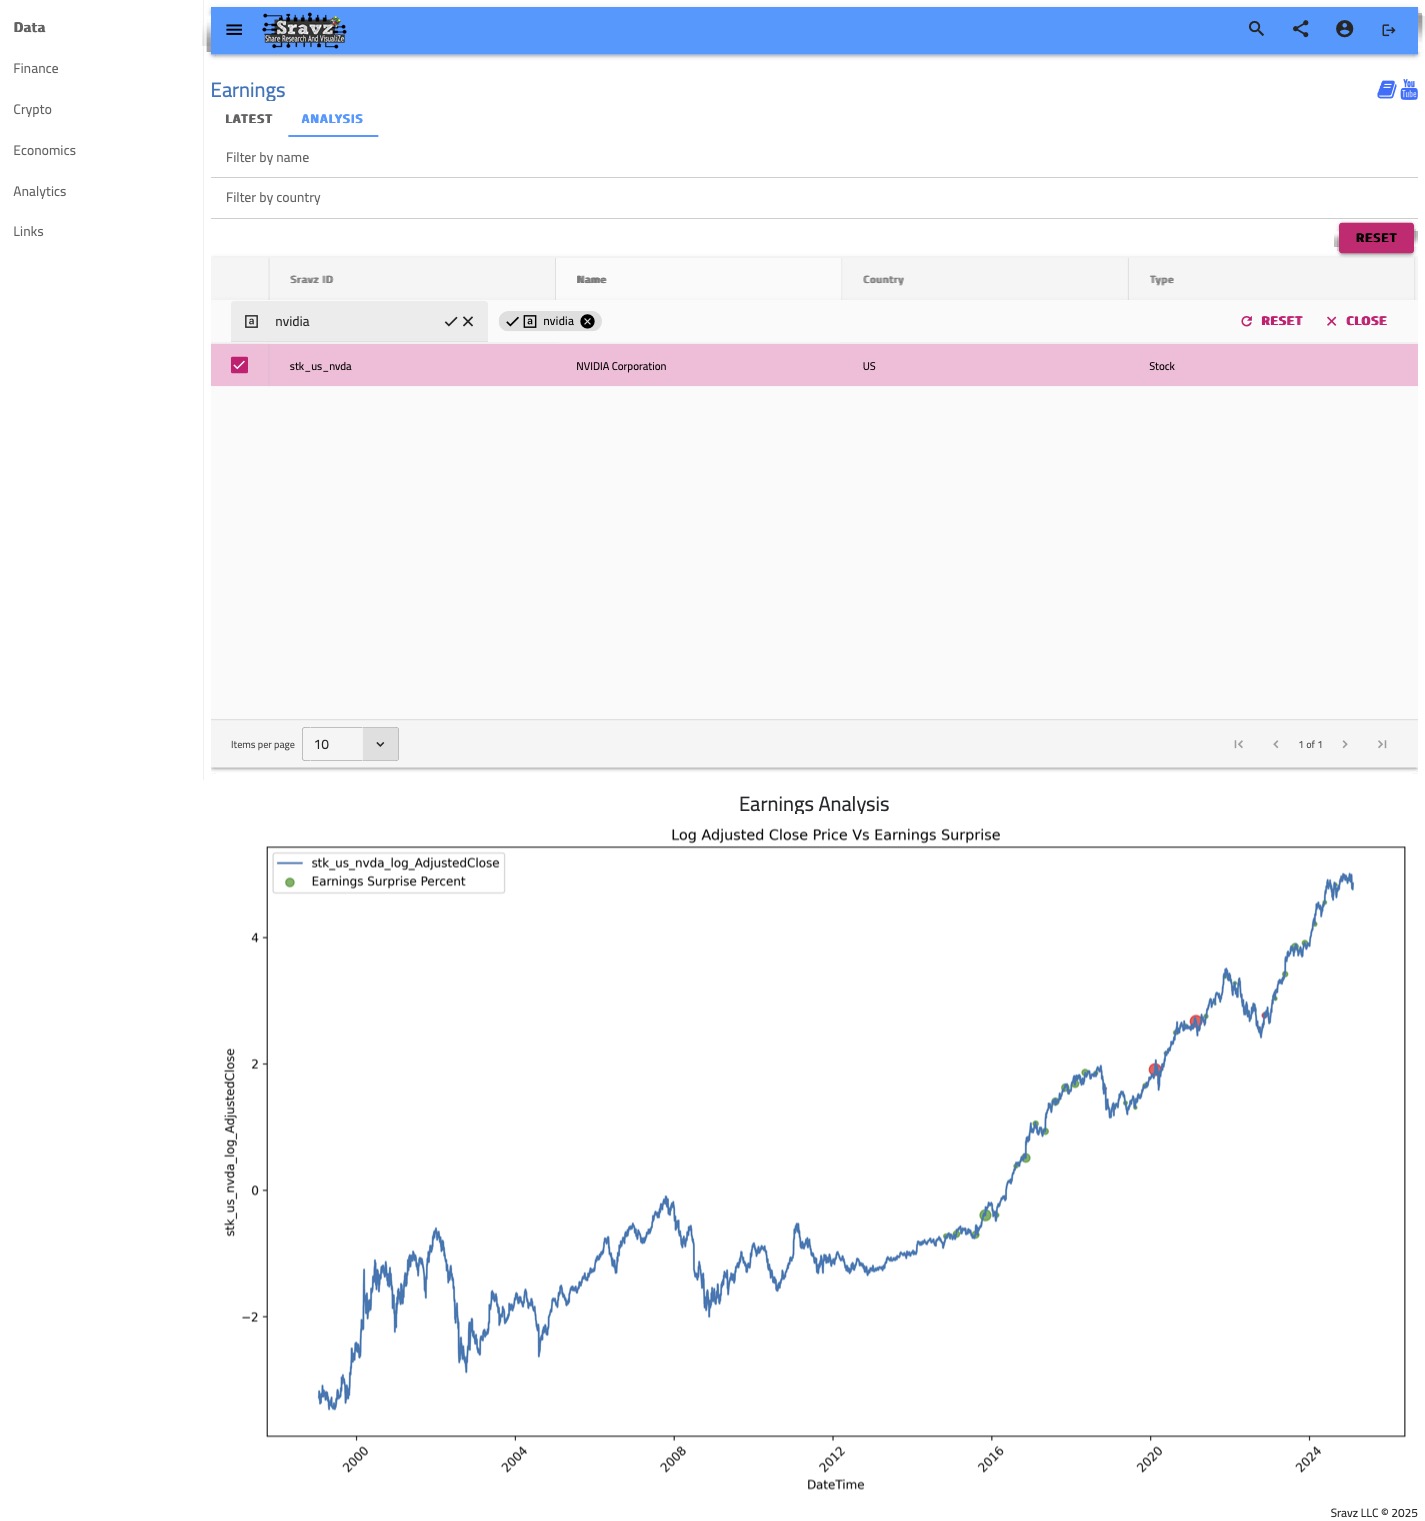
Analysis Tab
Stock Selection
Select any US stock from the asset grid to view its historical earnings analysis.
Earnings Analysis Chart
A dynamically generated chart showing:
- Historical earnings over multiple quarters
- Beat/miss pattern visualization
- Trend analysis over time
The chart is generated using the Rust backend for optimal performance.
By Country Tab
Country Distribution Chart
Column chart showing earnings reports by country:
- Top 10 countries with most earnings reports
- X-axis: Country code
- Y-axis: Number of reports
Country Breakdown List
Detailed list showing:
- Country flag avatar
- Country name
- Total report count
Timeline Tab
Temporal Distribution
Area chart showing earnings report density over time:
- Last 14 days of earnings activity
- Visualize earnings season patterns
- Identify peak reporting periods
Earnings Data Points
Each earnings record contains:
| Field | Description |
|---|---|
code | Stock ticker with country (e.g., AAPL.US) |
date | Fiscal period end date |
report_date | Actual announcement date |
actual | Reported EPS value |
estimate | Consensus analyst estimate |
difference | Actual minus estimate |
percent | Percentage surprise |
Color Coding Reference
| Performance | Color | Meaning |
|---|---|---|
| Beat | Green (#4CAF50) | Actual > Estimate |
| Miss | Red (#F44336) | Actual < Estimate |
| Met | Gray (#9E9E9E) | Actual = Estimate |
| Pending | Light Gray | Report not yet released |
Screenshots
Earnings Analytics Dashboard
Earnings Details Page
Earnings Bubble Chart Analysis
Related Pages
- YTD Performance - Year-to-date stock performance
- Insider Trades - SEC insider trading data
- Assets - Complete asset database