
Charts
The Charts page provides comprehensive visualization tools for analyzing financial assets across multiple dimensions. Access real-time data, historical trends, and technical analysis all in one place.
Supported Asset Types
| Asset Type | Description |
|---|---|
| Corporate Bonds | Investment-grade and high-yield corporate debt |
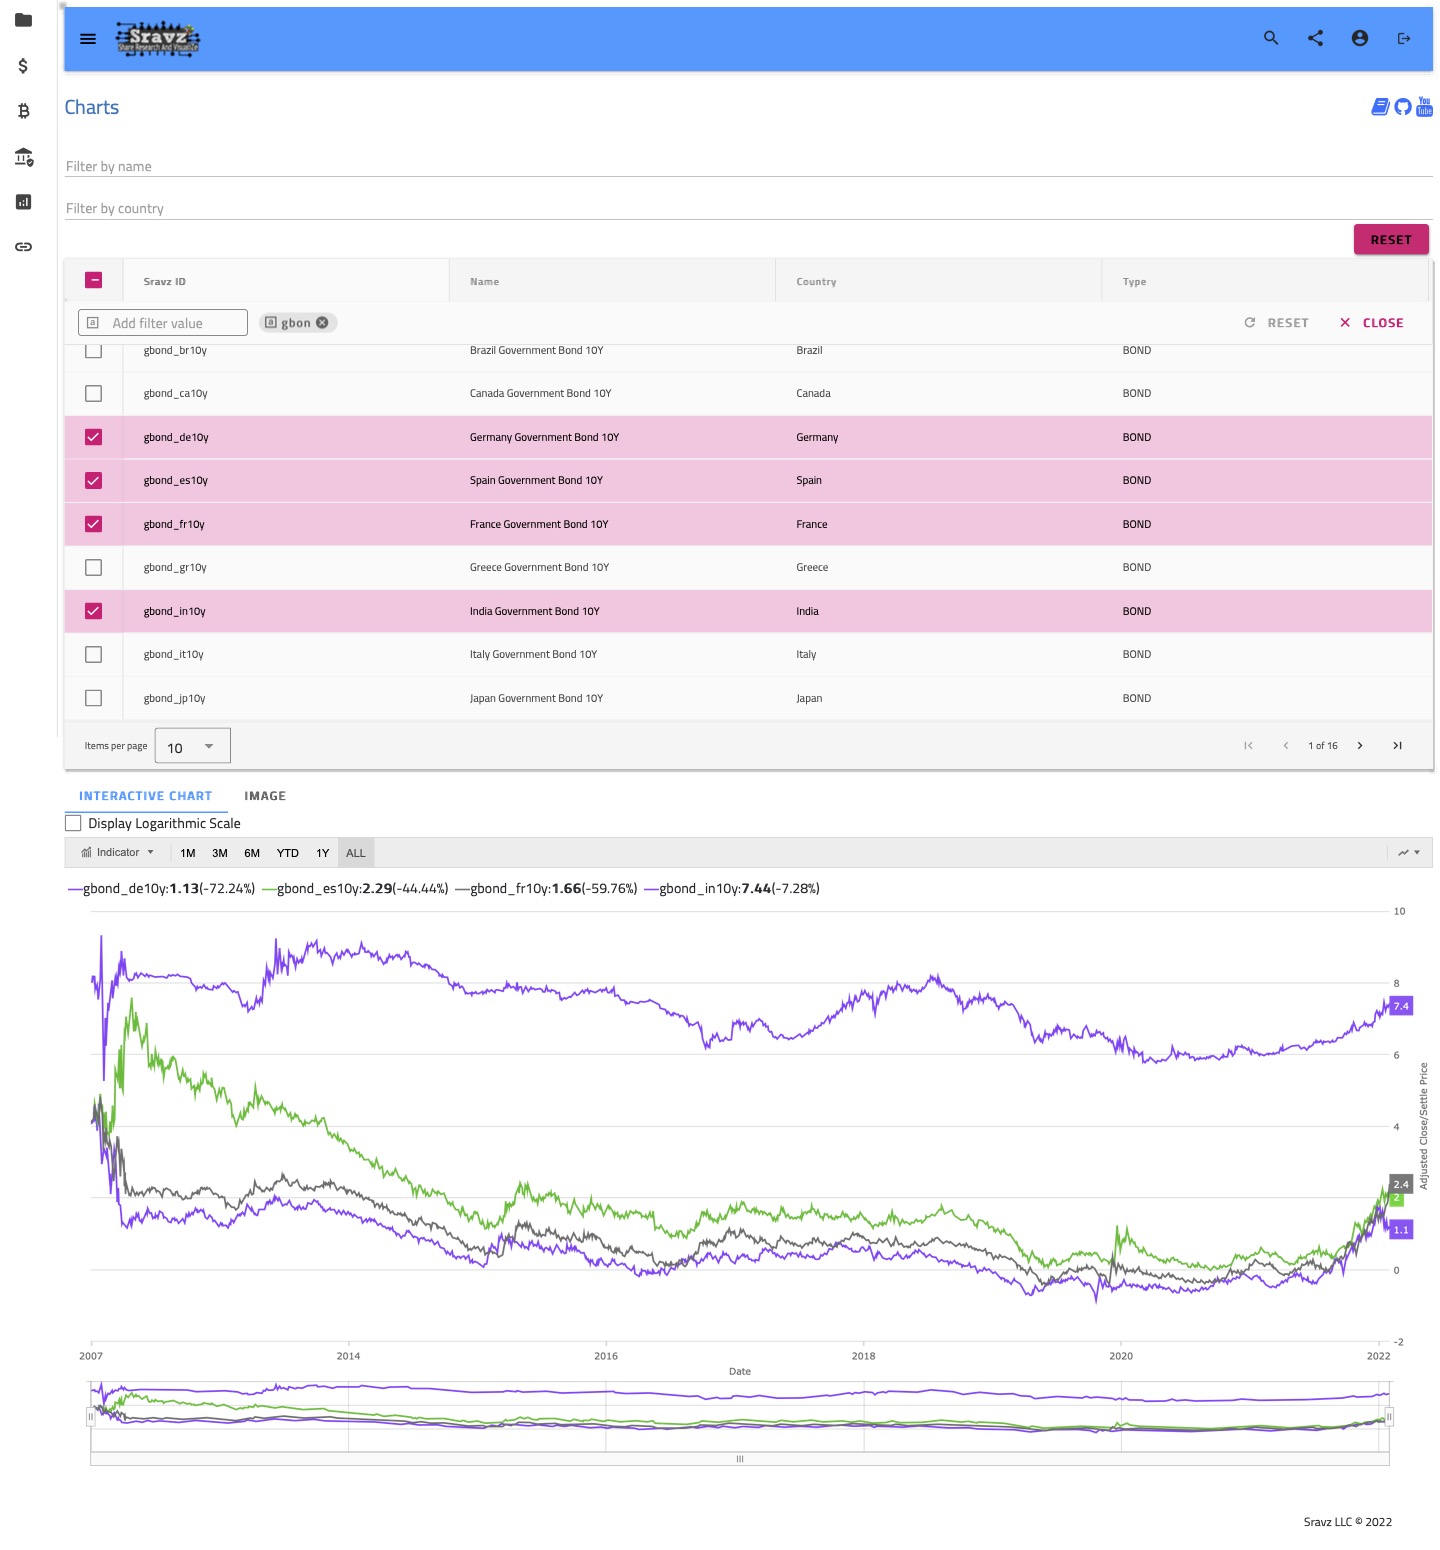
| Government Bonds | Treasury and sovereign debt instruments |
| Commodities | Physical goods (gold, oil, agricultural) |
| Common Stock | Equity shares of publicly traded companies |
| Currencies | Forex pairs and crypto currencies |
| Futures | Derivative contracts for future delivery |
| Indices | Market benchmarks (S&P 500, NASDAQ, etc.) |
| Rates | Interest rates and yield curves |
Chart Types
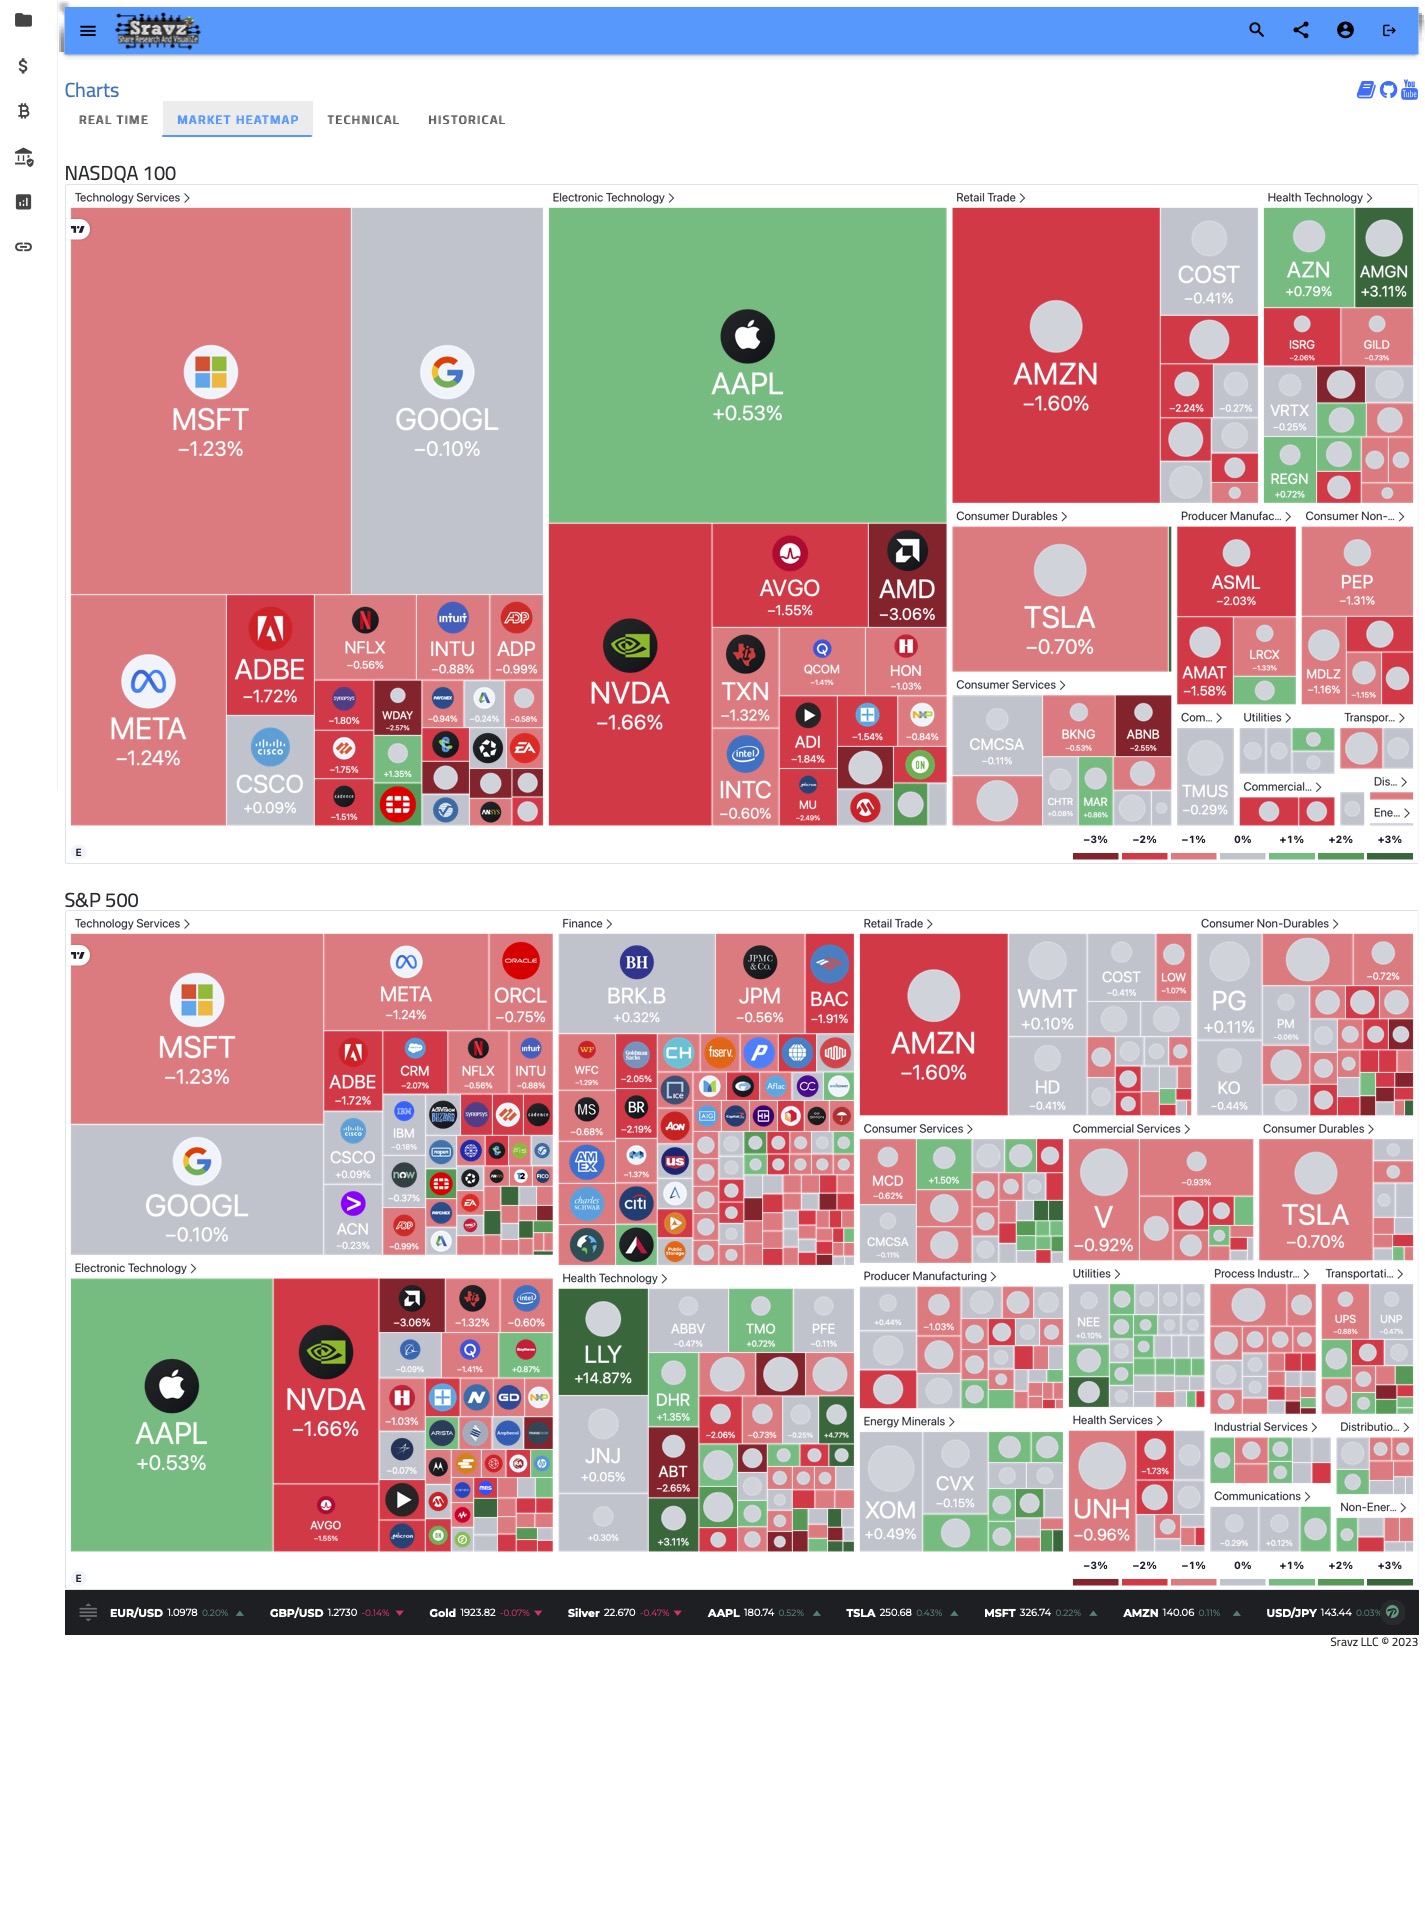
🗺️ Market Heat Map
Visualize market performance at a glance with color-coded heat maps showing gainers and losers across sectors.
Features:
- NASDAQ 100 companies
- S&P 500 companies
- Sector-level aggregation
- Real-time updates
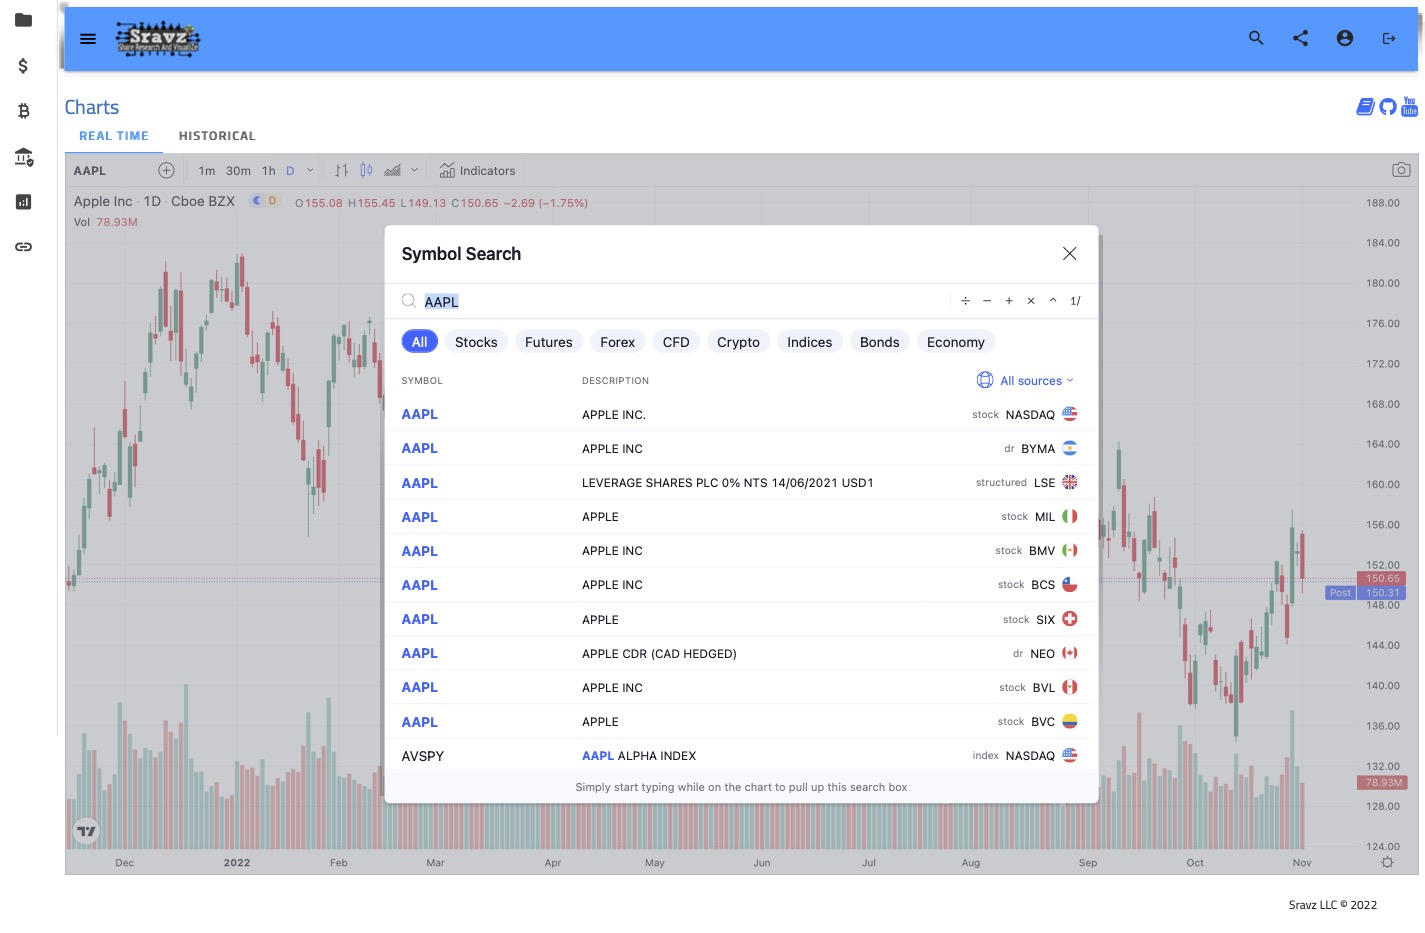
⚡ Real-Time Chart
Live streaming price data with sub-second updates for active trading.
📈 Interactive Charts
🔗 Launch Interactive ChartsFull-featured charting with technical analysis tools, overlays, and customizable time periods.
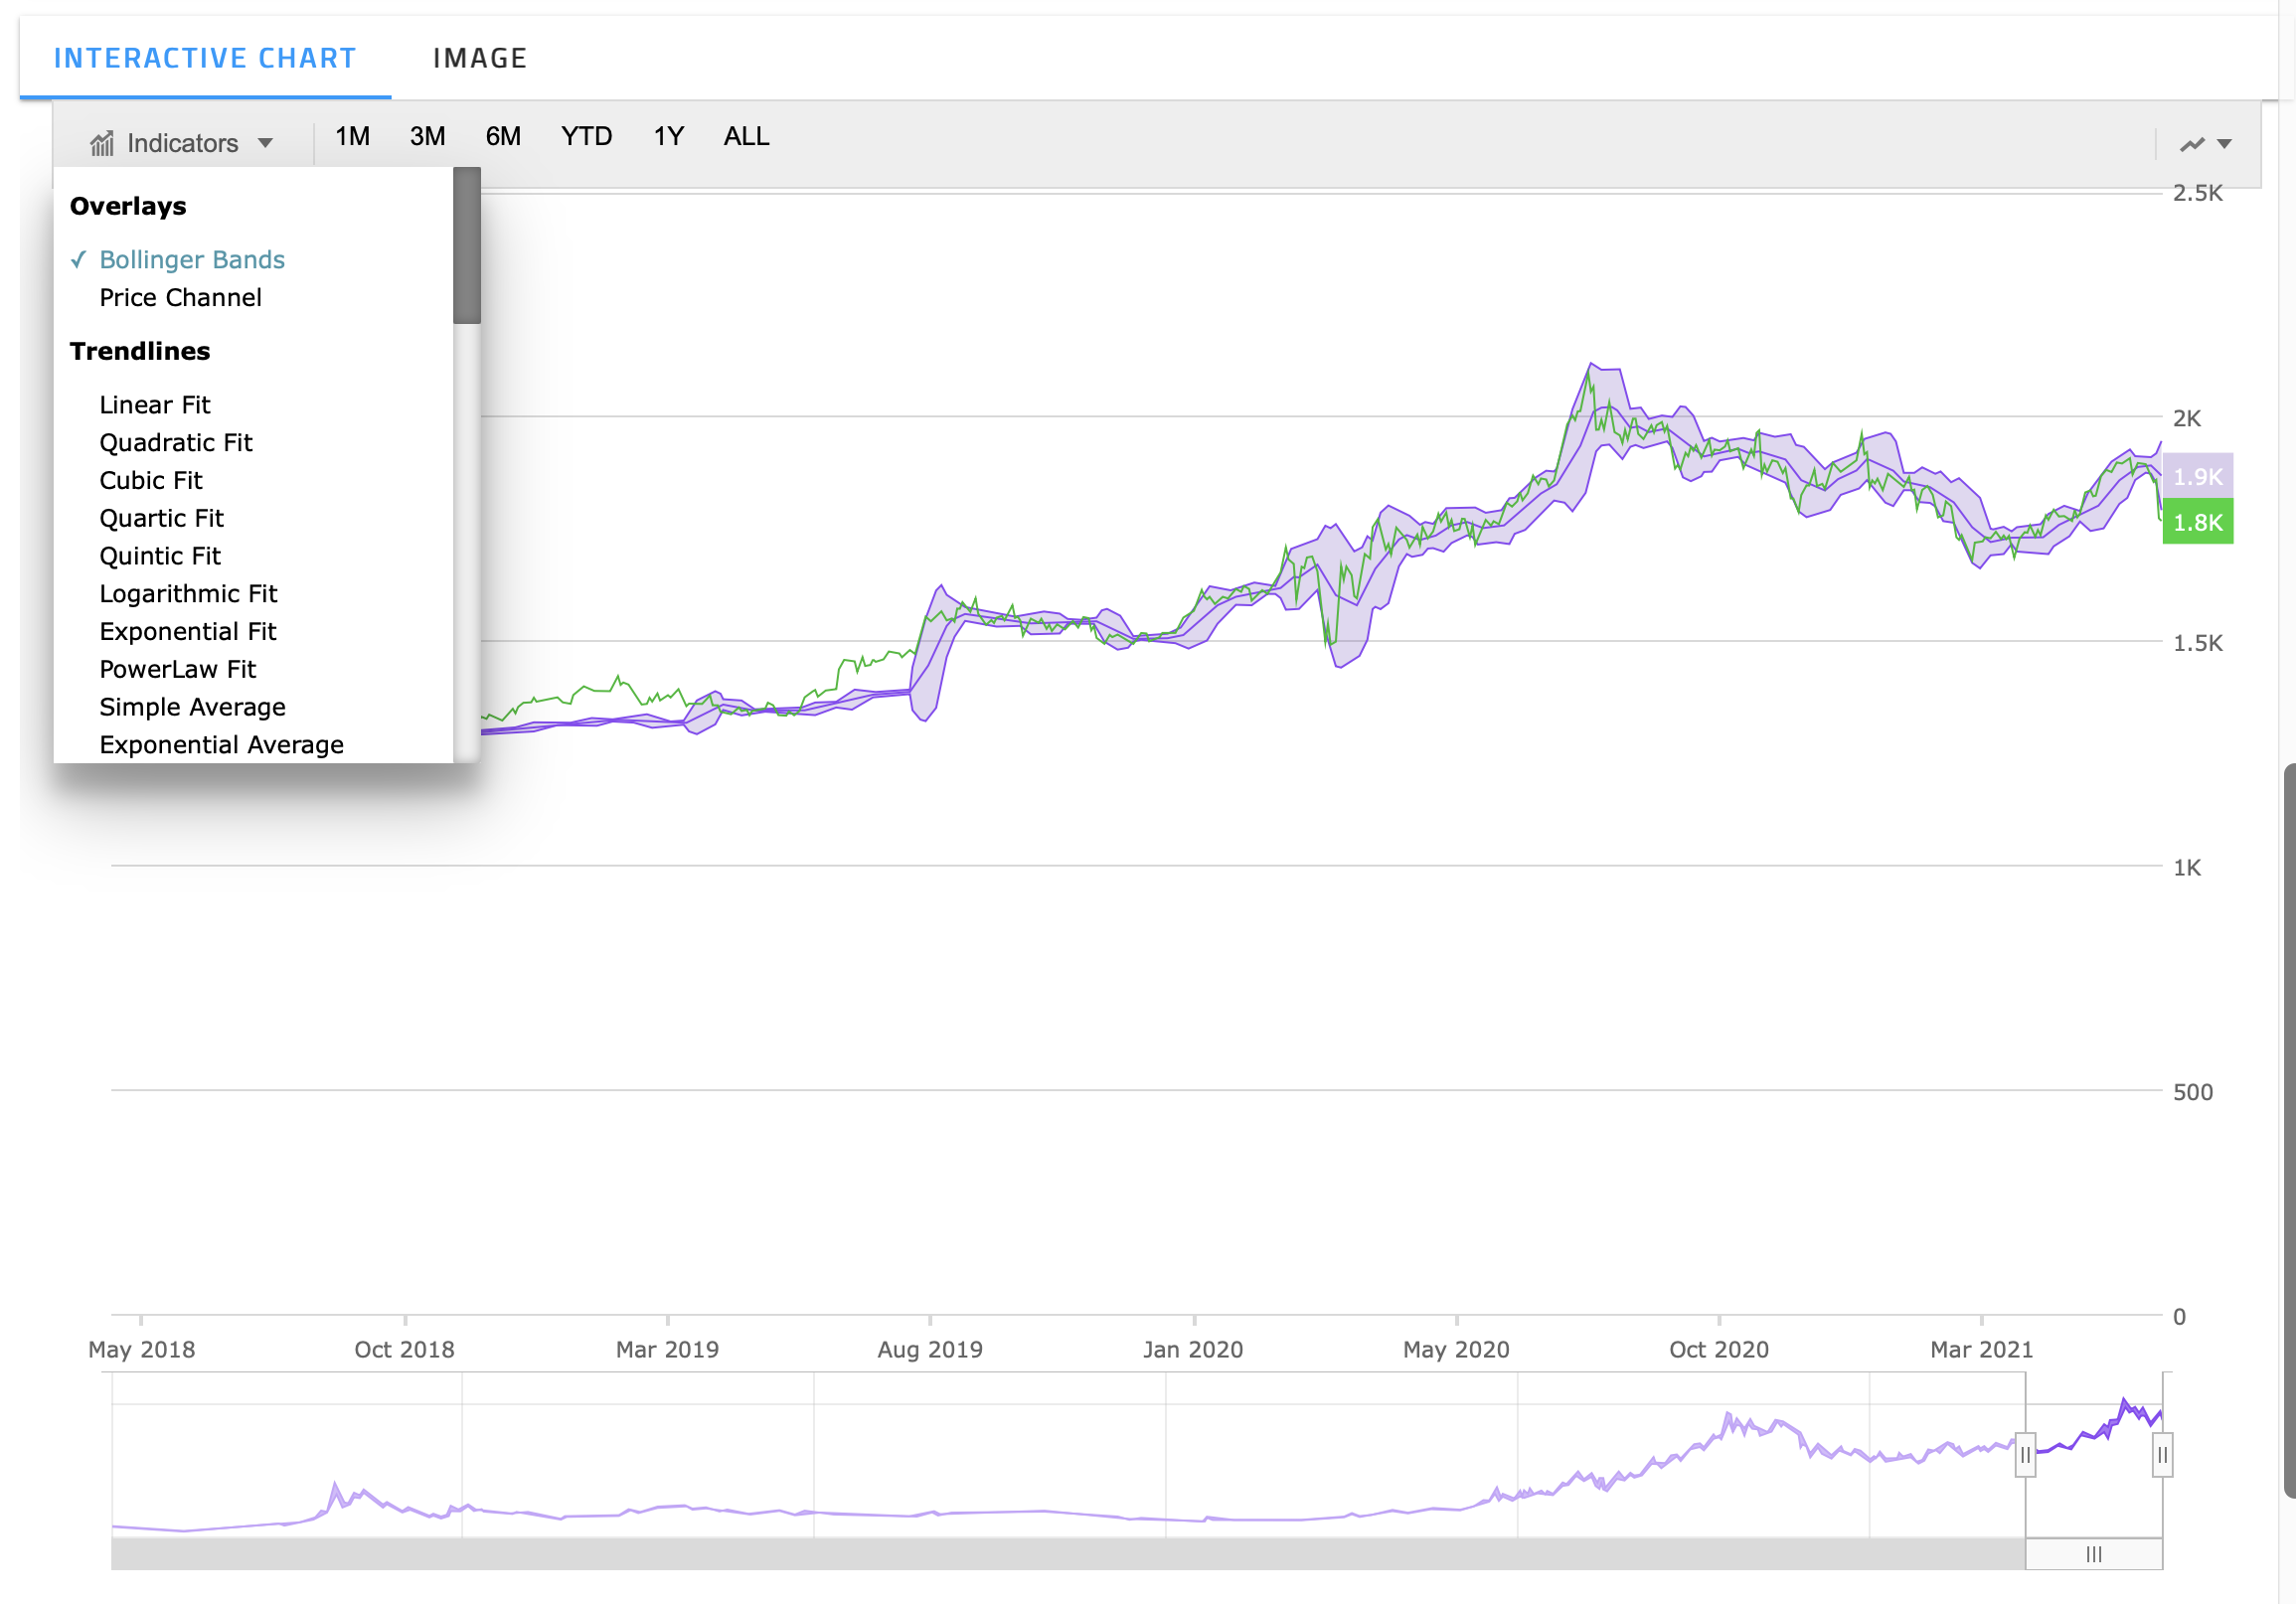
Technical Indicators
Overlays
| Indicator | Description |
|---|---|
| Bollinger Bands | Envelopes plotted at standard deviation levels above/below a moving average. Adjusts to volatility swings. |
| Price Channel | Bounded price range between two parallel lines. Can be horizontal, ascending, or descending. |
Trendlines
| Type | Description |
|---|---|
| Linear | Best-fit straight line for linear data showing steady increase/decrease |
| Quadratic | Second-order polynomial (y = a + bt + ct²) fitting |
| Cubic | Third-order polynomial (y = a + bt + ct² + dt³) fitting |
| Quartic | Fourth-order polynomial fitting for complex patterns |
| Quintic | Fifth-order polynomial for highly complex trends |
| Logarithmic | Fits ln(x) function - useful for rapid initial change then leveling |
| Exponential | Fits Ae^(kx) - all assets tend to change exponentially over time |
| Power Law | Y = kX^α - proportional relative changes |
Moving Averages
| Type | Description |
|---|---|
| Simple (SMA) | Average of all values: (x₁ + x₂ + … + xₙ)/n |
| Exponential (EMA) | Weighted average giving more weight to recent prices |
| Modified (MMA) | Includes sloping factor to catch up with price movements |
| Cumulative | Mean of all points up to and including current |
| Weighted | Assigns weightage based on relative importance |
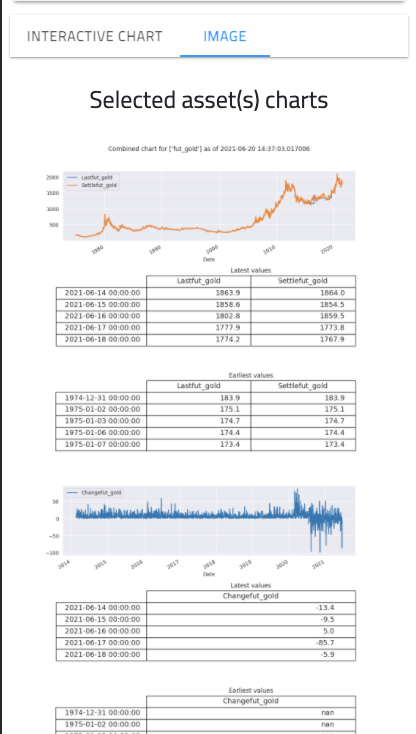
🖼️ Chart Image
Static image export showing comprehensive asset analysis including:
- Latest and earliest 5 days of last/settle prices
- Latest and earliest 5 days of price changes
- Latest and earliest 5 days of volume data
🔀 Cross Asset Analysis
Compare multiple assets across different asset classes to identify correlations, divergences, and relative performance.
Use Cases:
- Compare stock vs bond performance
- Analyze currency impact on commodities
- Track sector rotation patterns
- Identify safe-haven correlations
Quick Start
- Navigate to the Charts page at sravz.com/asset/all
- Select one or more assets from the grid (up to 10)
- Click Submit to generate charts
- Switch between Interactive Chart and Image tabs
- Use the toolbar to add indicators, change chart types, and zoom
💡
Pro Tip: Use logarithmic scale when comparing assets with vastly different price ranges to better visualize percentage changes.