
Assets Analytics Dashboard
The Assets page provides a comprehensive analytics dashboard for viewing all tracked financial instruments across exchanges and markets worldwide.
Dashboard Overview
The Historical tab features an analytics-driven interface with multiple visualization components to help users understand asset distribution and coverage.
Summary Statistics
Four key metrics are displayed at the top of the dashboard:
| Metric | Description |
|---|---|
| Total Assets | Complete count of all tracked financial instruments |
| Exchanges | Number of unique trading venues covered |
| Countries | Geographic coverage across different markets |
| Asset Types | Variety of instrument categories tracked |
Distribution Charts
The dashboard includes interactive charts organized in tabs:
Type Distribution
- Pie Chart: Visual breakdown of assets by instrument type (Stock, ETF, Index, Forex, Crypto, Commodity, Bond, Mutual Fund, Option, Future)
- Ranked List: Top 5 asset types with percentage of total
By Exchange
- Column Chart: Top 10 exchanges by number of listed assets
- Exchange Breakdown: Detailed list with asset counts
By Country
- Column Chart: Top 10 countries by asset coverage
- Country Breakdown: Geographic distribution details
Timeline
- Area Chart: Asset addition trends over the last 12 months
- Shows growth patterns in the asset database
Distribution Cards
Three summary cards provide quick insights:
- Top Exchanges - Rankings of exchanges with the most assets, featuring progress bars
- Top Countries - Geographic distribution with visual indicators
- Asset Categories - Color-coded chips showing asset type counts
Recent Assets
An expandable panel displays the last 10 assets added to the system, including:
- Asset symbol and name
- Type classification (color-coded)
- Exchange listing
- Date added
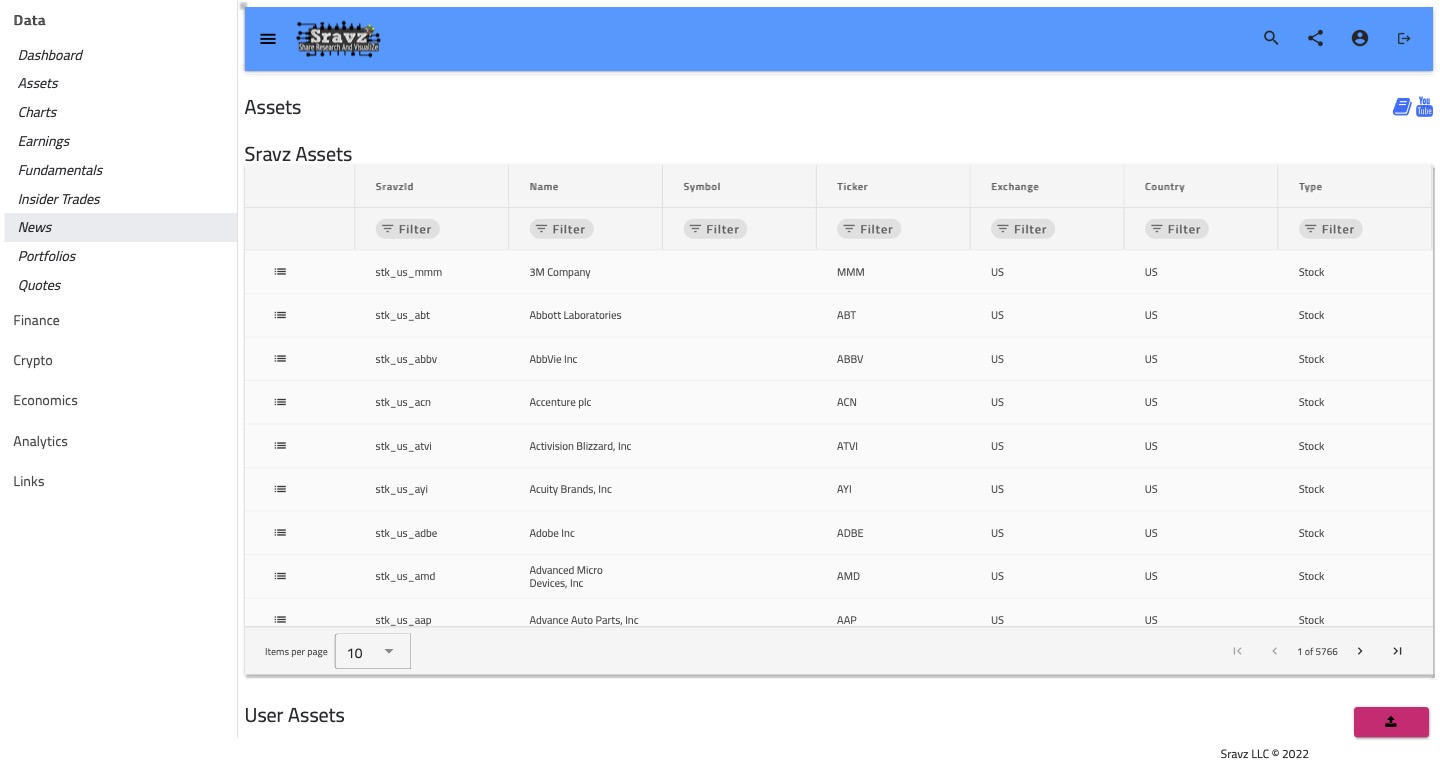
Complete Asset Database
The full asset grid is available in an expandable panel with:
- Symbol - Trading symbol (highlighted chip)
- Name - Full asset name
- Type - Color-coded instrument type (Stock=green, ETF=blue, Index=purple, etc.)
- Exchange - Trading venue badge
- Country - Geographic location with flag avatar
- Ticker - Alternative ticker symbol
Features include:
- Column filtering
- Pagination (10 items per page)
- Click-through to asset details
User Assets
Users can upload custom assets in CSV format by clicking the upload button in the User Assets tab.
CSV Format Requirements
Sample CSV file should contain the following headers and data:
| Date | Volume | High | Last | Low | OpenInterest | Open | Change | Settle |
|---|---|---|---|---|---|---|---|---|
| 2018-07-24 | 108.57 | 108.82 | 107.26 | 107.66 | 26307774 | 1.00 | 11.12 | 13.0 |
- Date: Format YYYY-MM-DD
- Numeric Columns: All other columns are float values
Asset Type Color Coding
| Type | Color | Hex |
|---|---|---|
| Stock | Green | #4CAF50 |
| ETF | Blue | #2196F3 |
| Index | Purple | #9C27B0 |
| Forex | Orange | #FF9800 |
| Crypto | Red | #F44336 |
| Commodity | Brown | #795548 |
| Bond | Blue Grey | #607D8B |
| Mutual Fund | Cyan | #00BCD4 |
| Option | Pink | #E91E63 |
| Future | Indigo | #3F51B5 |
Screenshots
Asset Analytics Dashboard
Related Pages
- Asset Details - Individual asset information and charts
- Insider Trades - SEC insider trading data