Pyfolio Returns Analysis
Performs returns analysis of assets and portfolios for last 10 yrs. S&P 500 returns are used as benchmark.
Use Case
Sravz Pyfolio Returns Analysis page can be used compare the performance of your stock/bond/etf w.r.t to S&P 500 returns over last 10 yrs.
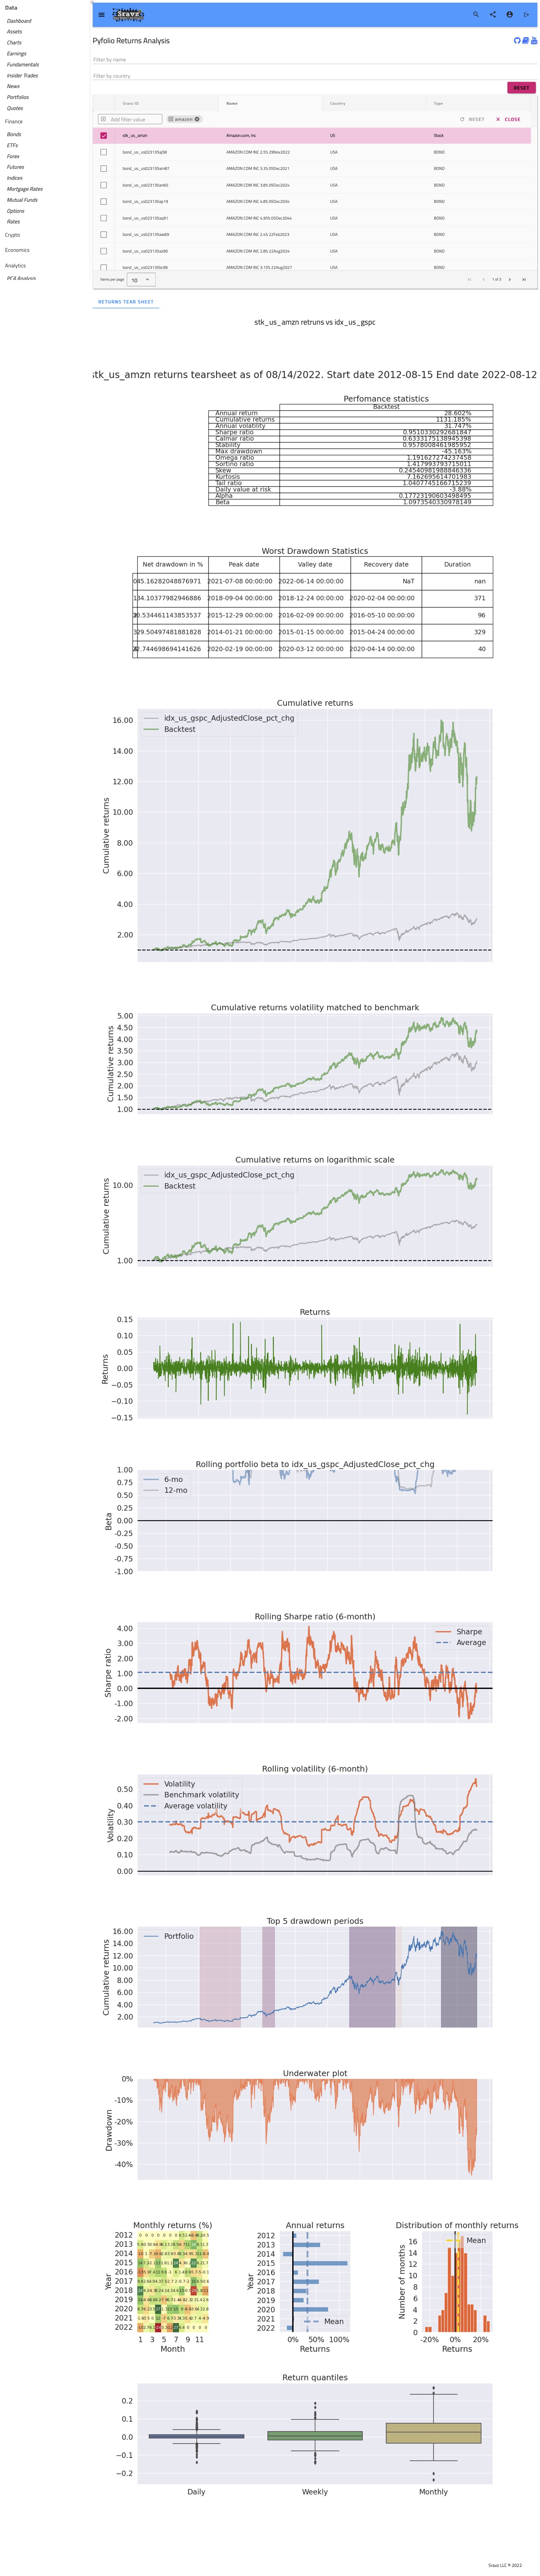
Pyfolio Returns Analysis - Screenshot
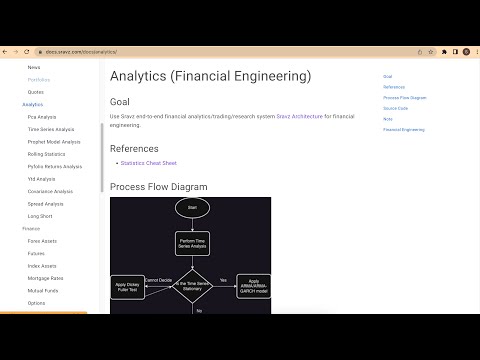
Video explanation
Pyfolio Returns Analysis - Description
- Returns tear sheet
- Peformance statistics
- Annual Returns: % annual returns
- Cum Returns Final: % cummulative returns in last 10 years
- Annual volatility: % annual volatility (risk)
- Sharp Ratio: Compares performance of an asset w.r.t risk free asset.
- Calmar Ratio:
- Compounded annual growth rate divided by the maximum drawdown.
- The maximum drawdown is the maximum peak to trough of the returns measured over a three year period.
- Stability of TimeSeries:
- Determines R-squared of a linear fit to the cumulative returns.
- Computes an ordinary least squares linear fit and returns R-squared.
- Max drawdown:
- Maximum loss that occurrend on the portfolio
- Omega Ratio:
- Defined as the probability weighted ratio of gains versus losses for some threshold return target
- Threshold is set to 0
- Higher Omega Ratio is good for the portfolio
- Sortino Ratio:
- Sharp Ratio uses complete volatility in the denominator. Upside + Downside volatility
- Sortino Ratio uses only Downside volatility in the denominator
- Skew:
- Positive Skew: Positive skew indicates that the tail is on the right side of the distribution
- Negative Skew: Indicates that the tail is on the left side of the distribution
- Zero Skew: Normal distribution. Tails are equal on both side of the distribution
- Kurtosis:
- Higher kurtosis corresponds to more frequent extreme deviations (or outliers), as opposed to frequent modestly sized deviations.
- Kurtosis of Normal distribution is 3
- Tail ratio:
- Determines the ratio between the right (95%) and left tail (5%).
- For example, a ratio of 0.25 means that losses are four times as bad as profits.
- Common Sense Ratio:
- Multiplication of the tail ratio and the Gain-to-Pain-Ratio – sum(profits) / sum(losses)
- Information Ratio:
- (Portfolio returns - Benchmark Returns)/Tracking Error
- Tracking error = STD of difference between portfolio and benchmark returns
- Show how portfolio manager provides extra information to achieve returns over benchmark returns
- Value at risk:
- Value at risk is a statistical metric that forecasts the highest possible loss and the probability of it occurring over a particular period.
- Alpha:
- Represents by how much percent the portfolio beats the benchmark
- Zero alpha indicates the portfolio perfectly tracks the benchmark index
- Beta:
- Shows how much risk the asset/portfolio will add (or potentially subtract) from a diversified portfolio.
- (Covariance of Asset/Portfolio Returns, Market returns)/Variance of Market Returns
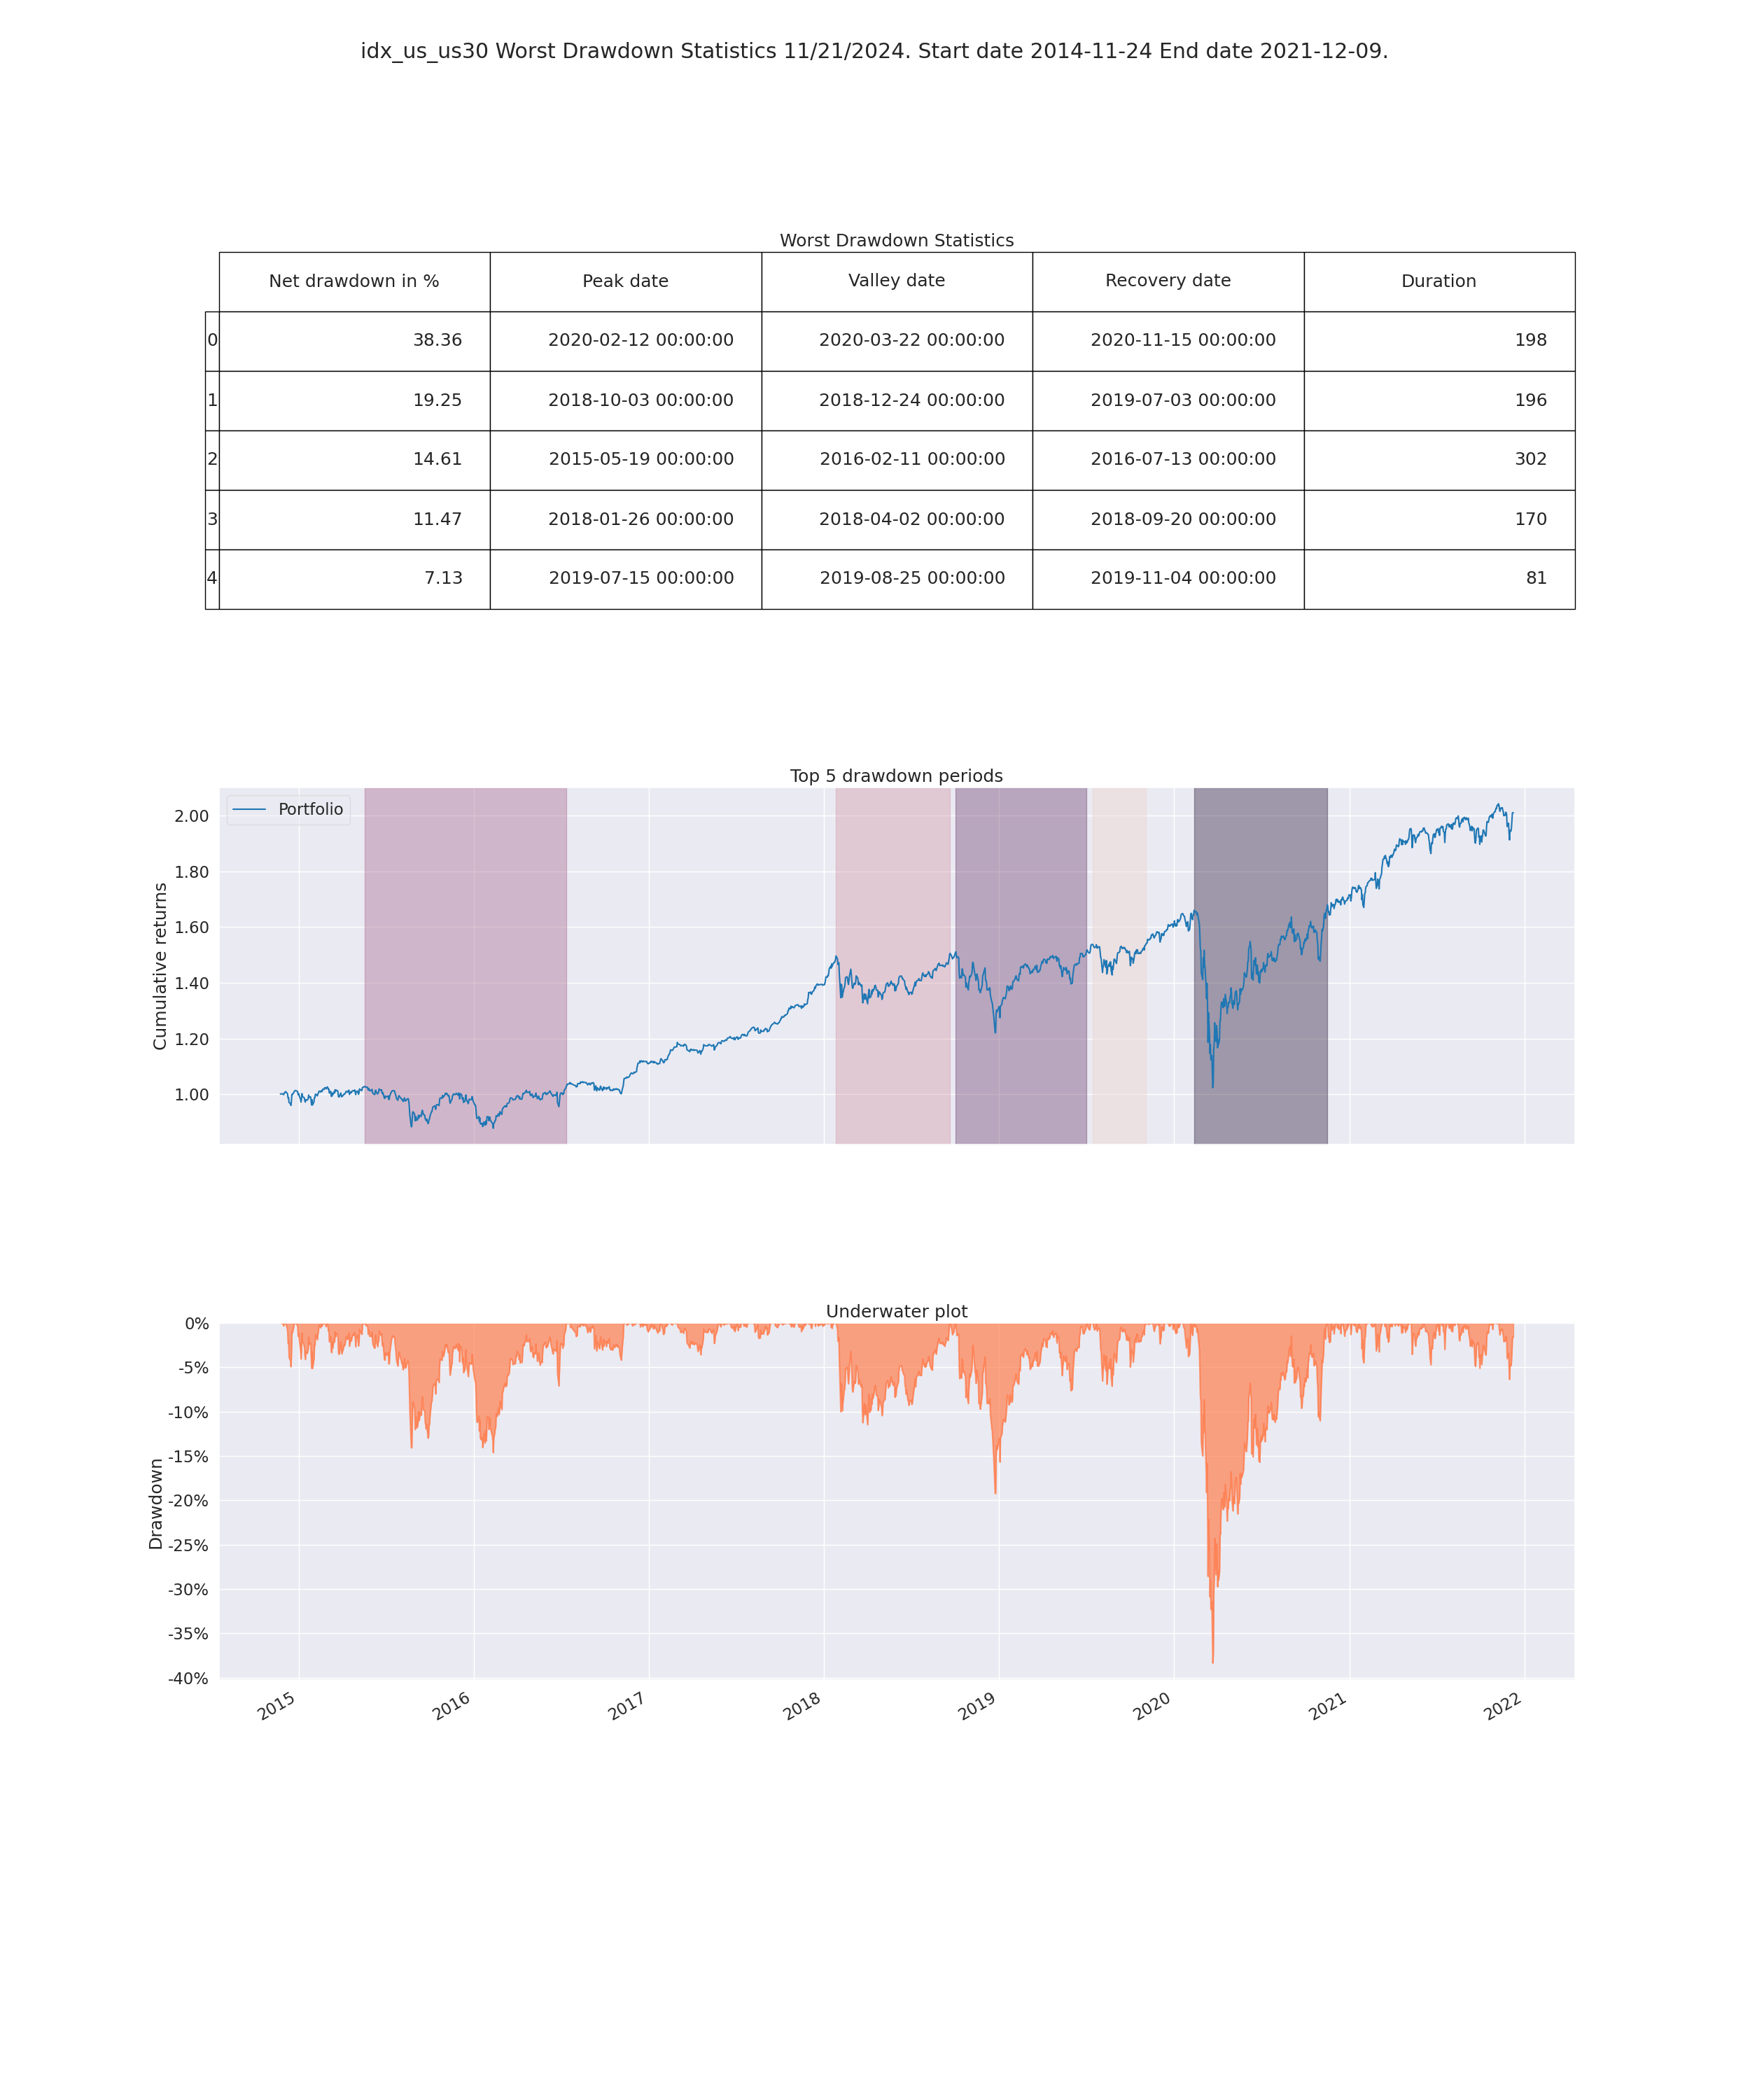
- Peformance statistics
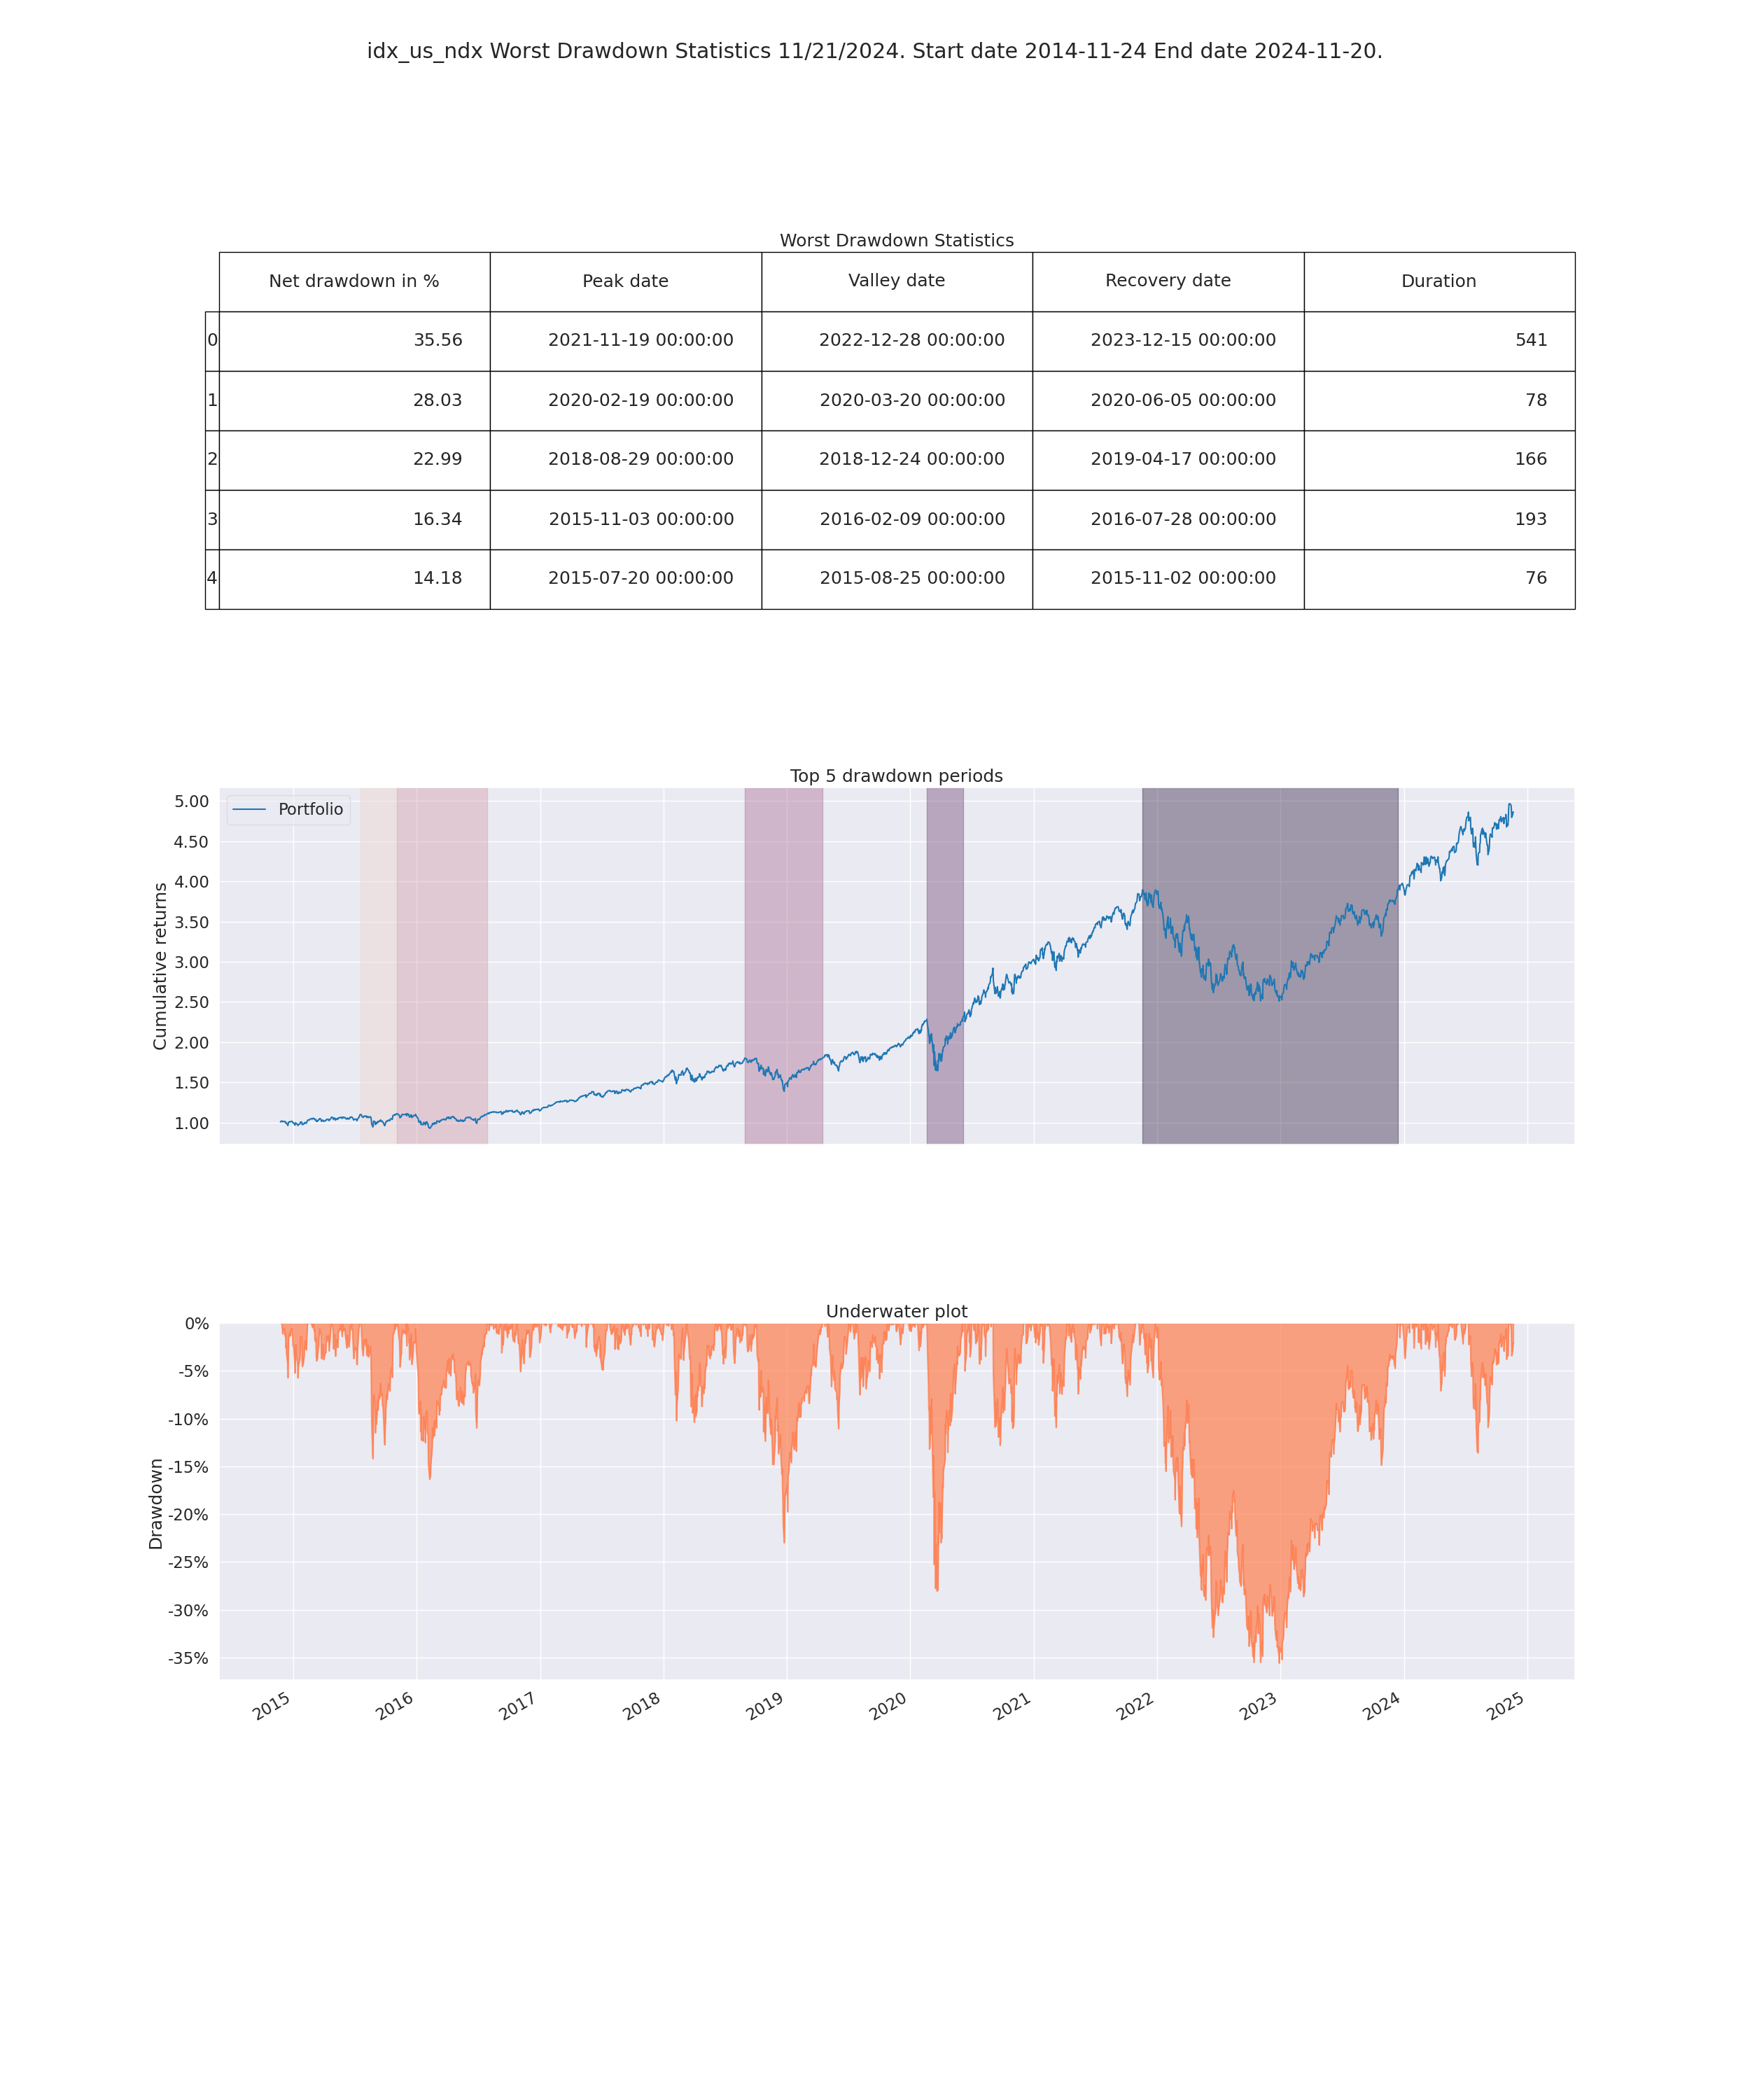
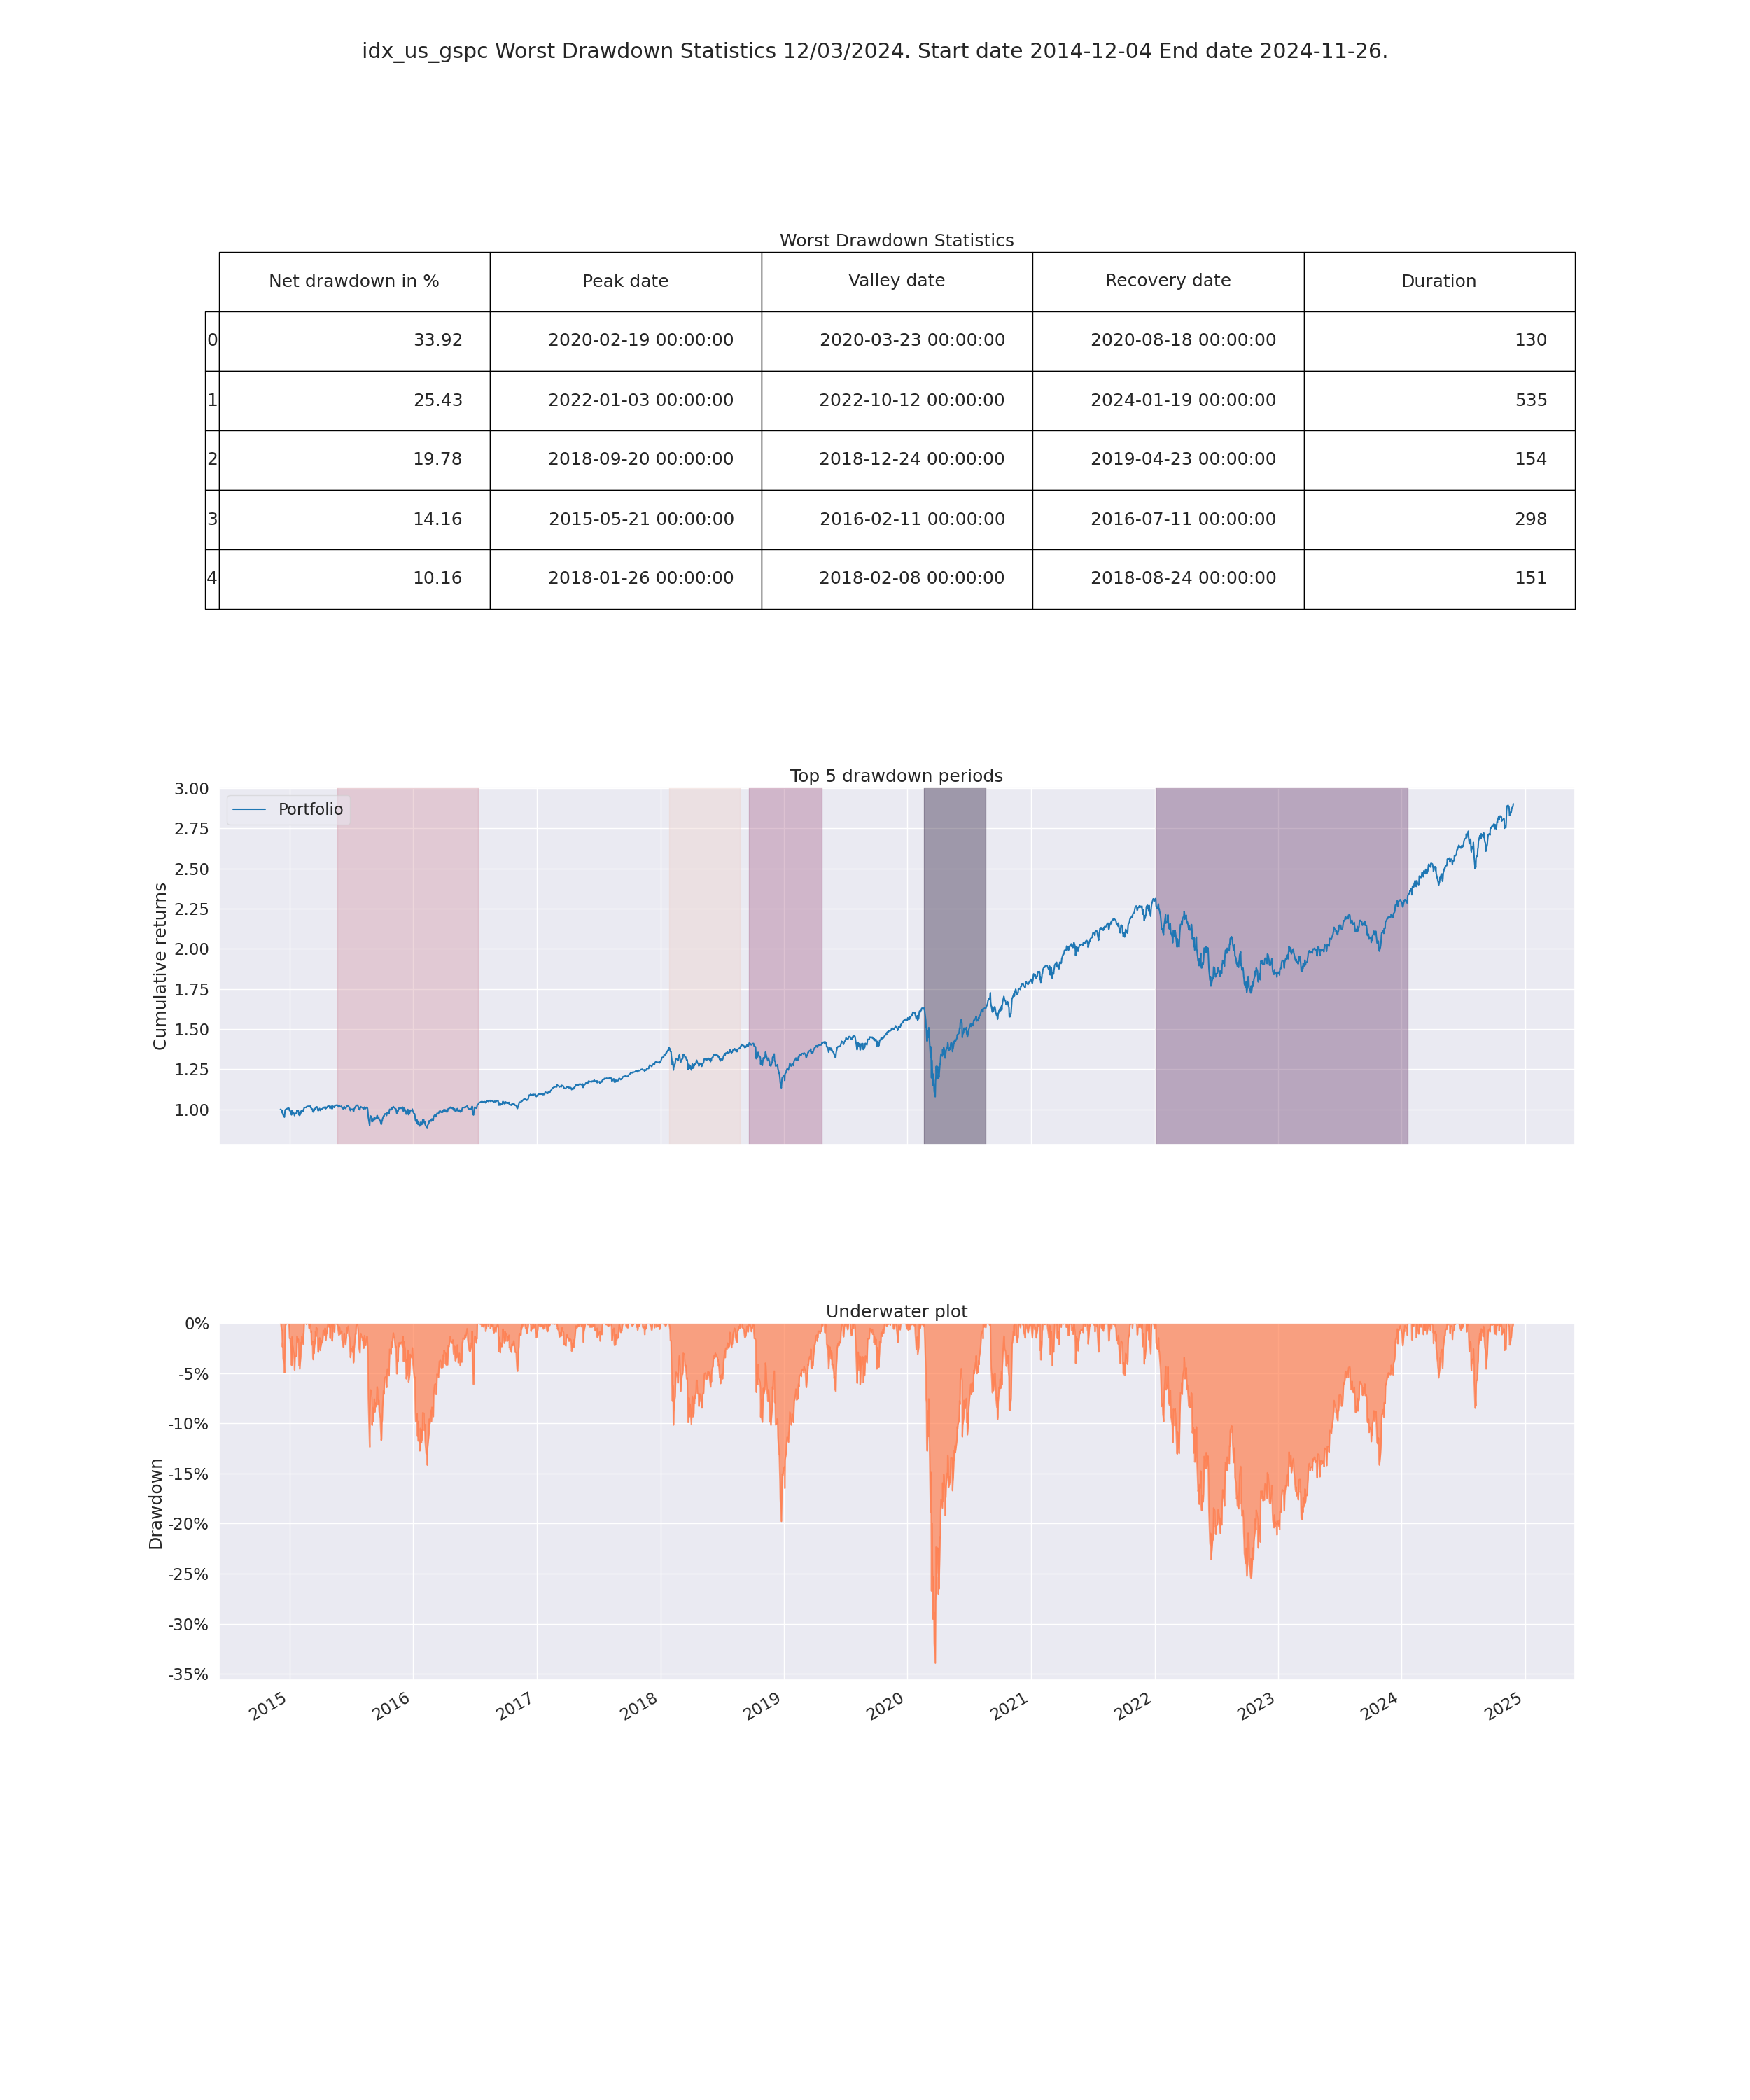
- Worst Drawdown Statistics
- Display loss experienced during each loss period
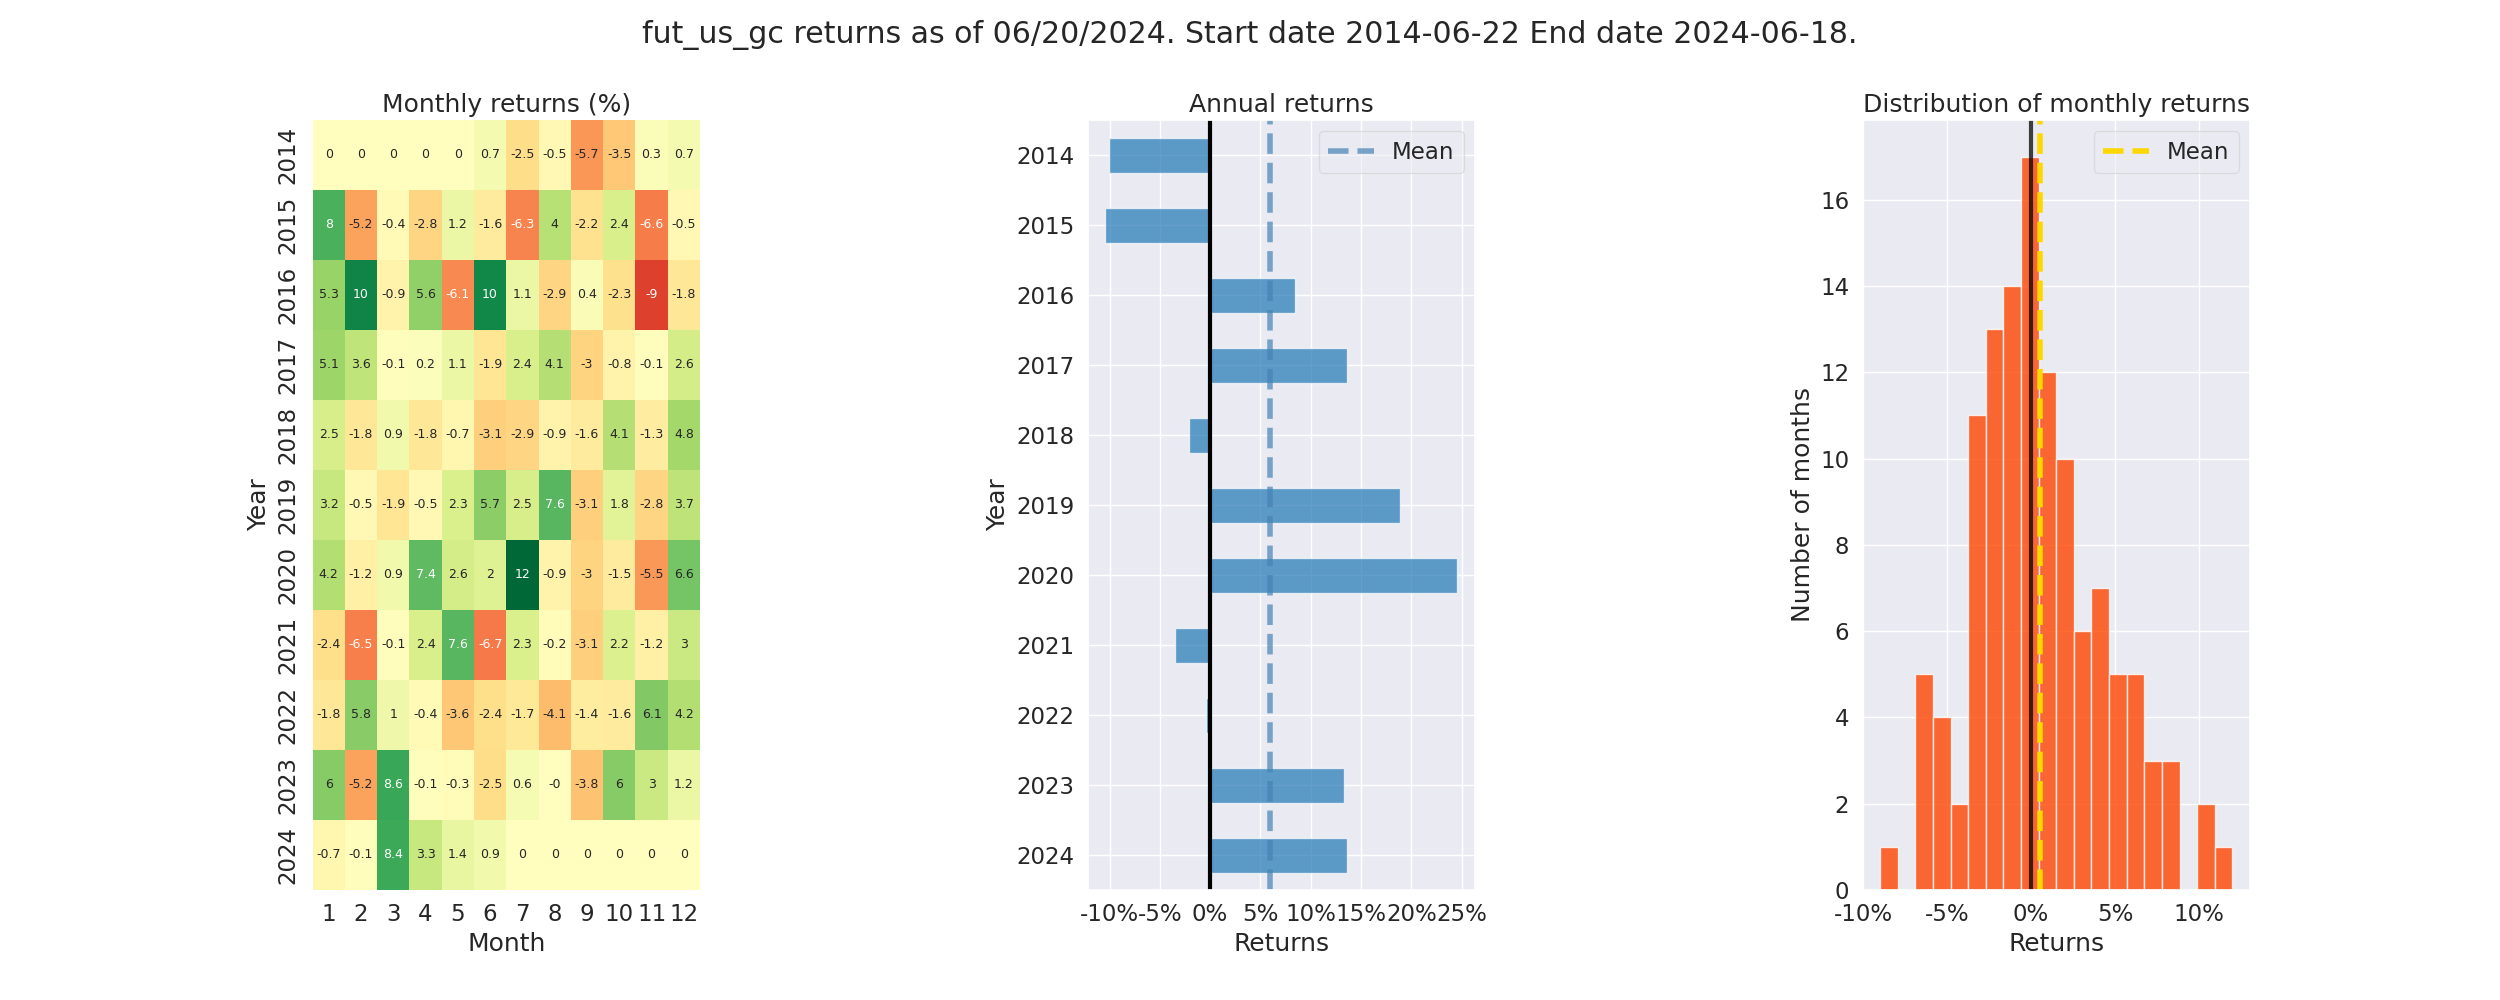
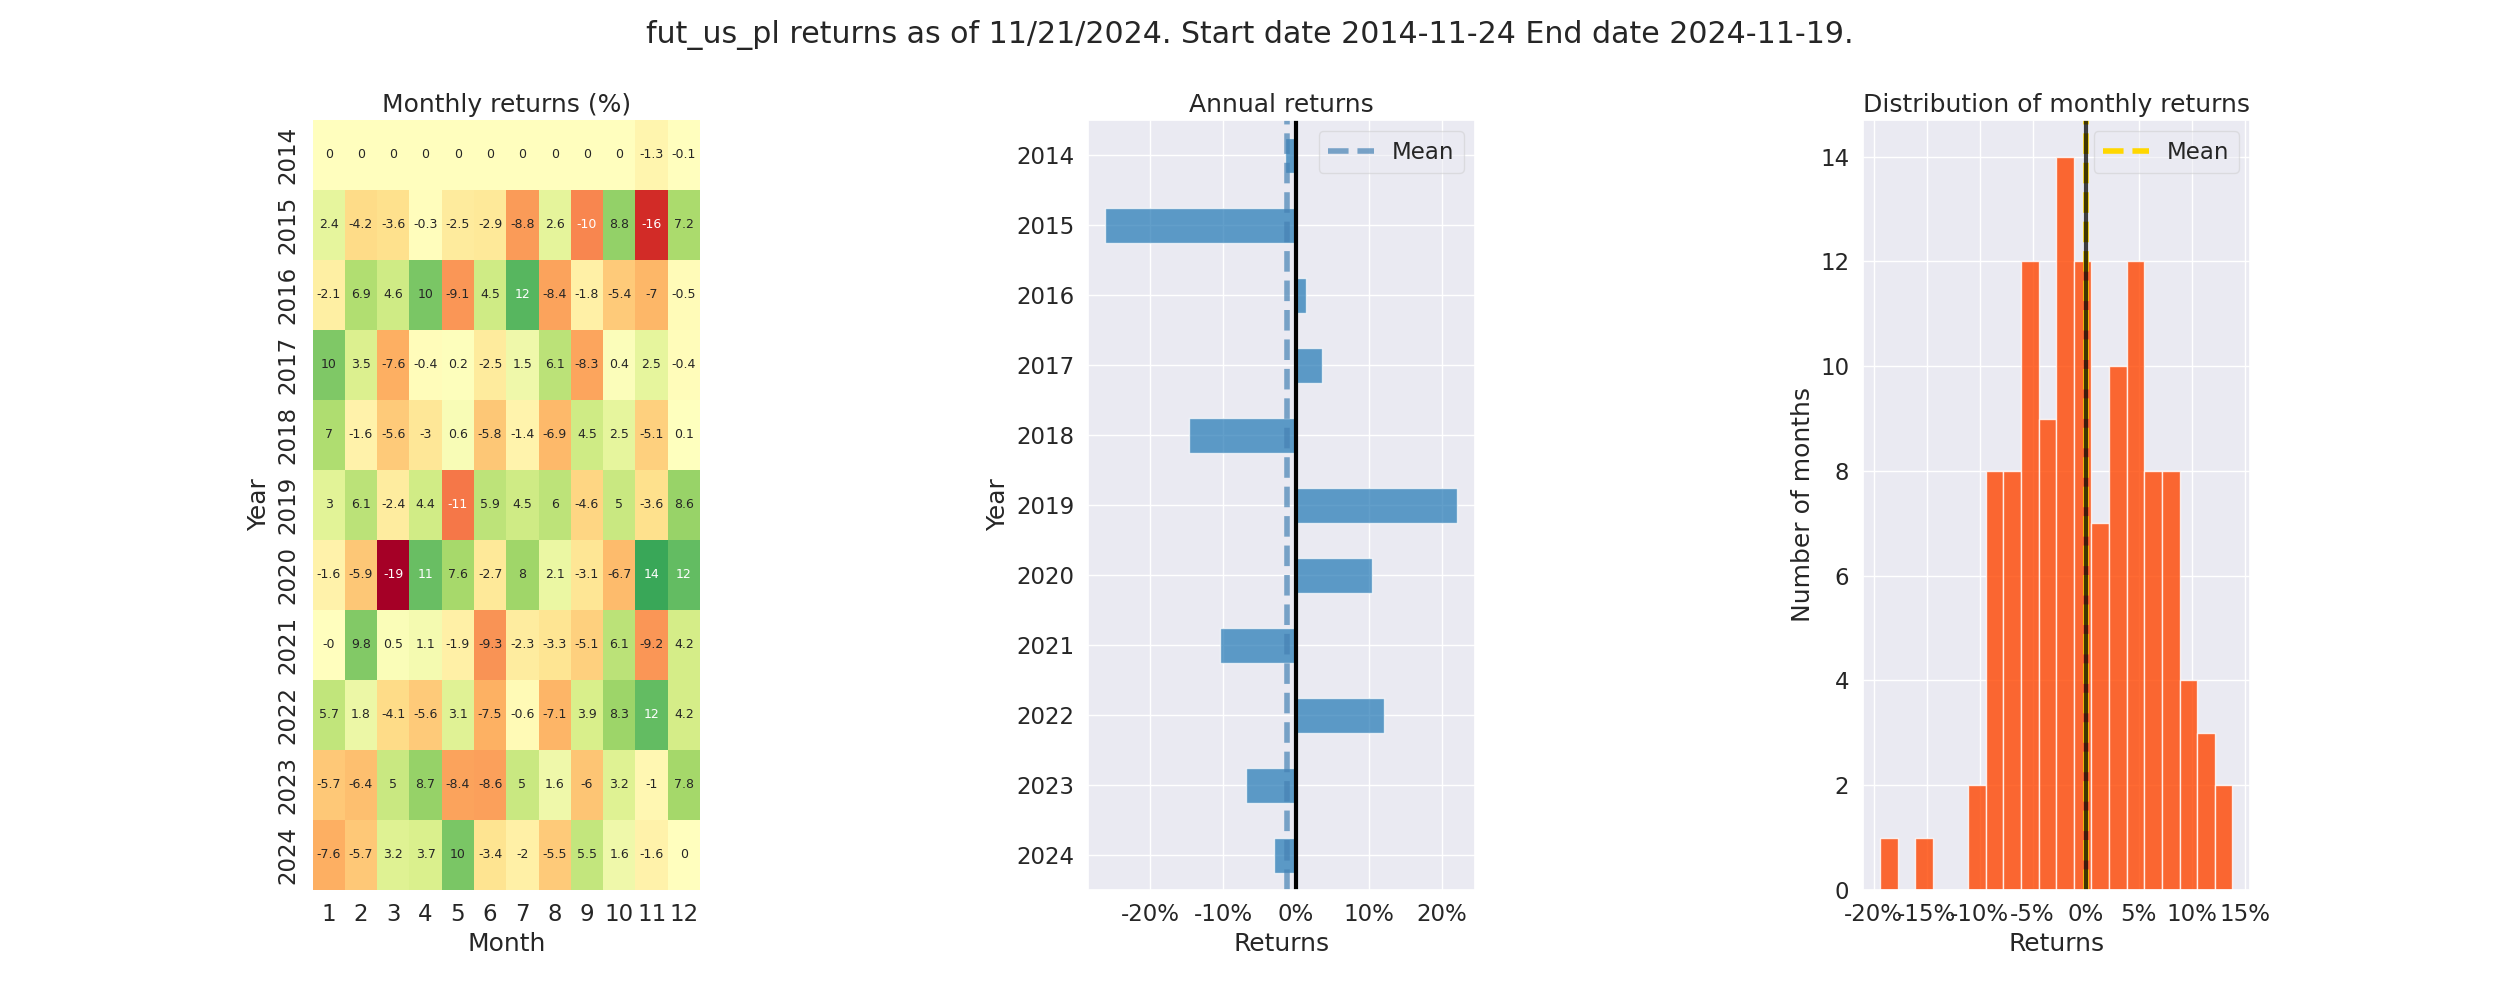
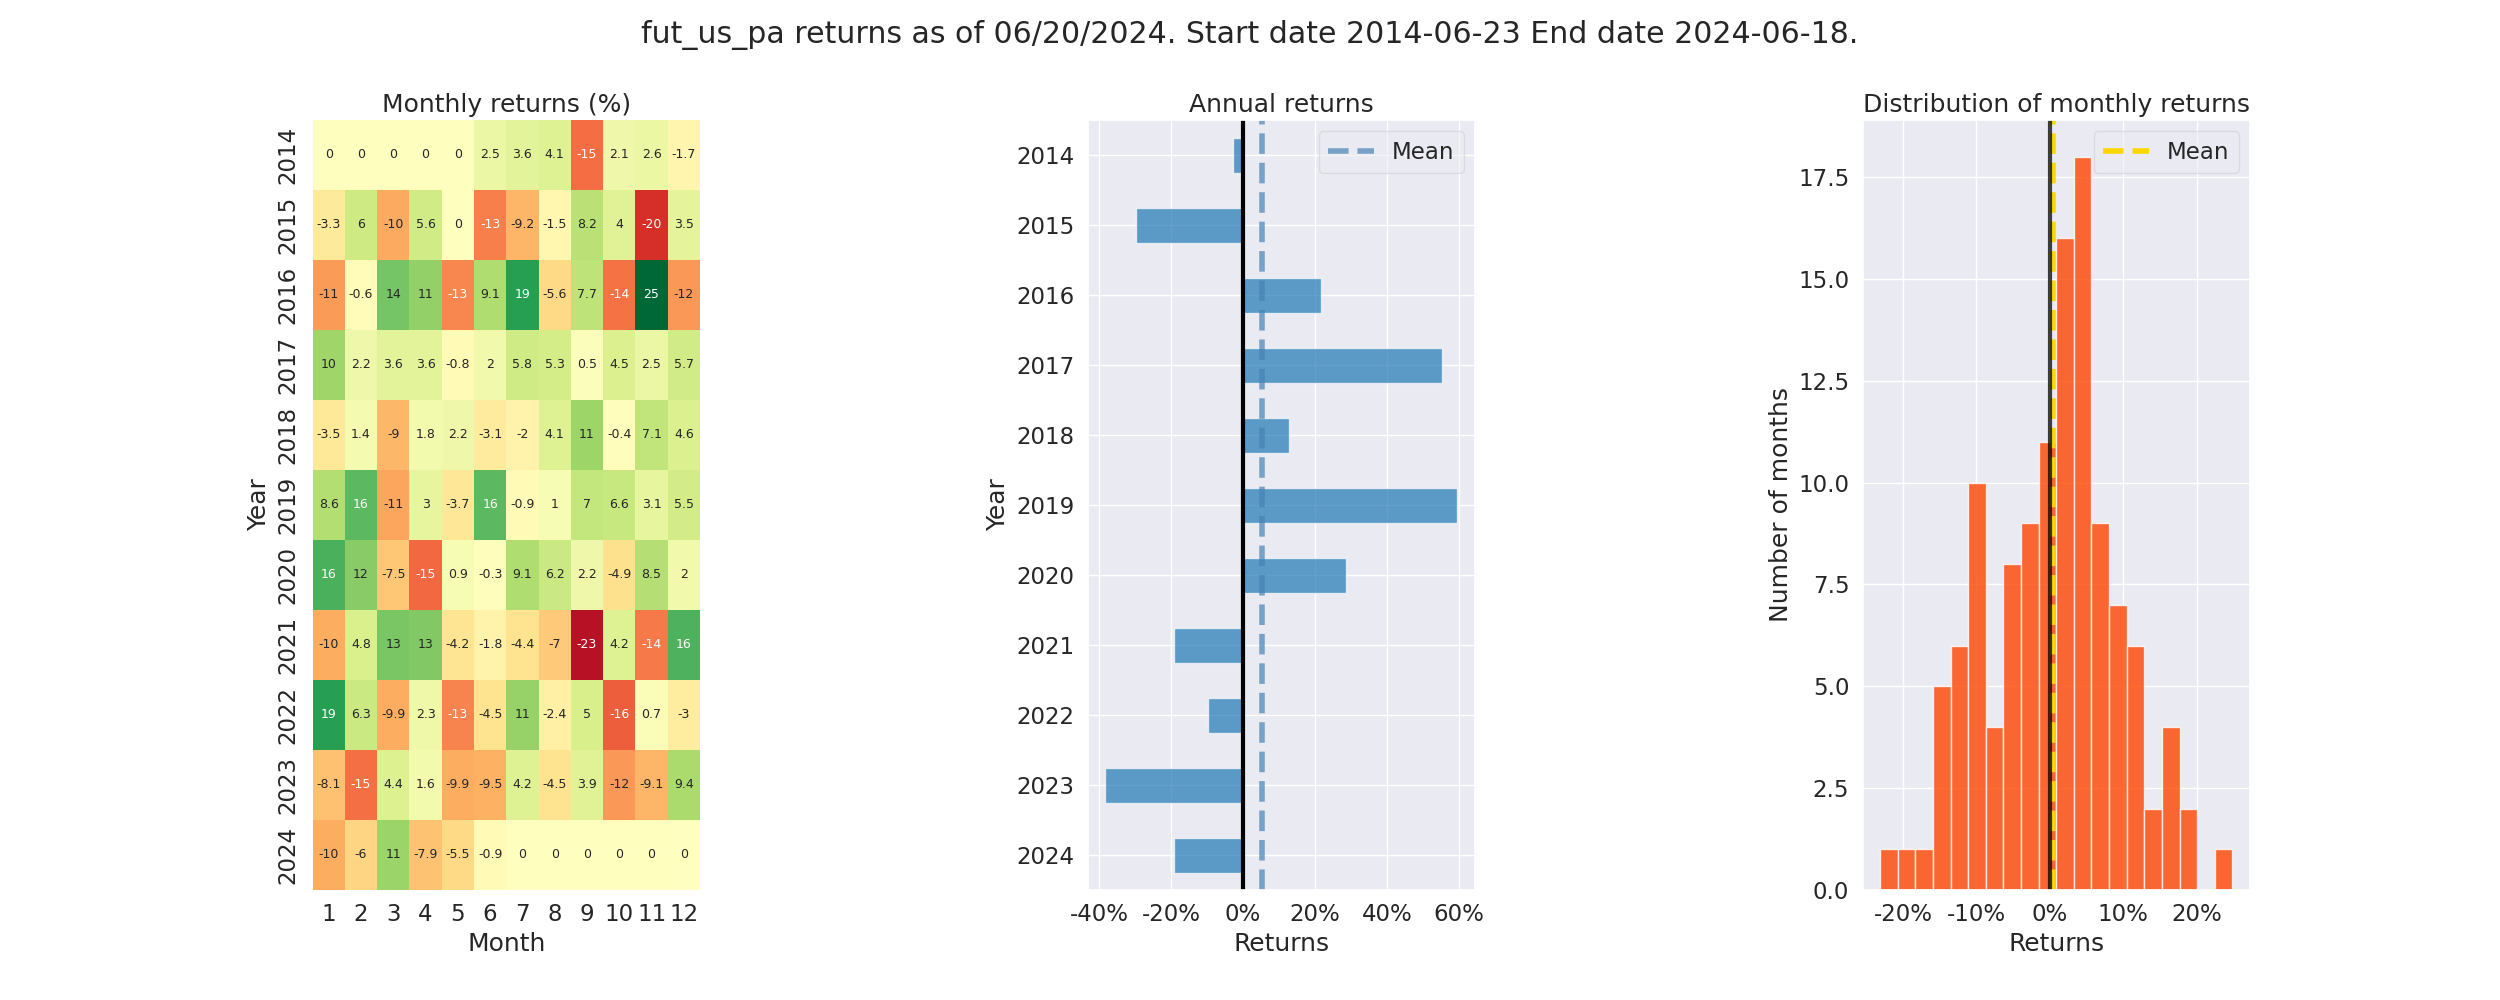
Pyfolio Returns Analysis - Monthly Returns - Precious Metals
Gold Futures Monthly Returns
Platinum Futures Monthly Returns
Palladium Futures Monthly Returns
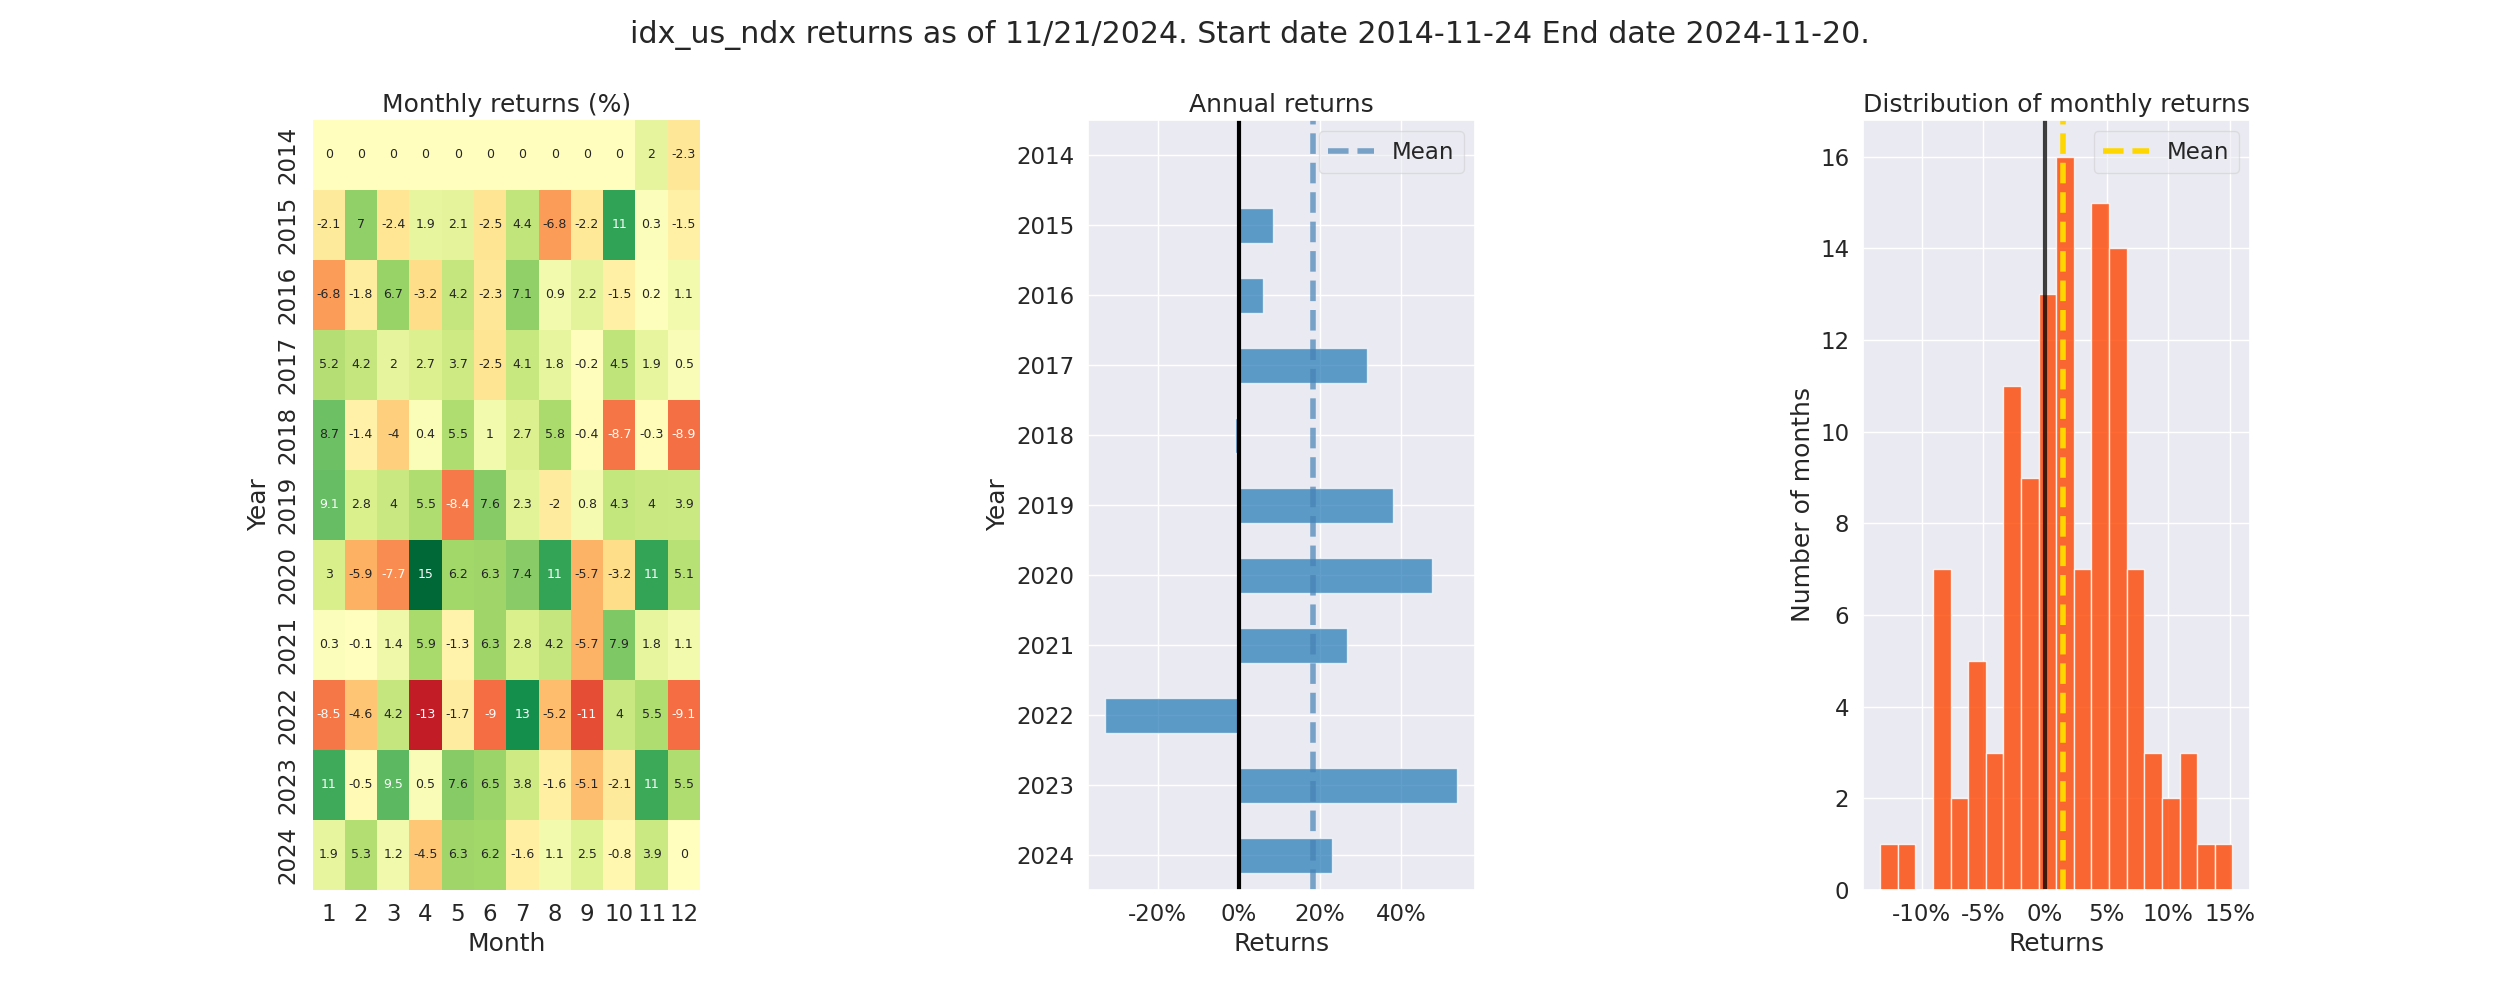
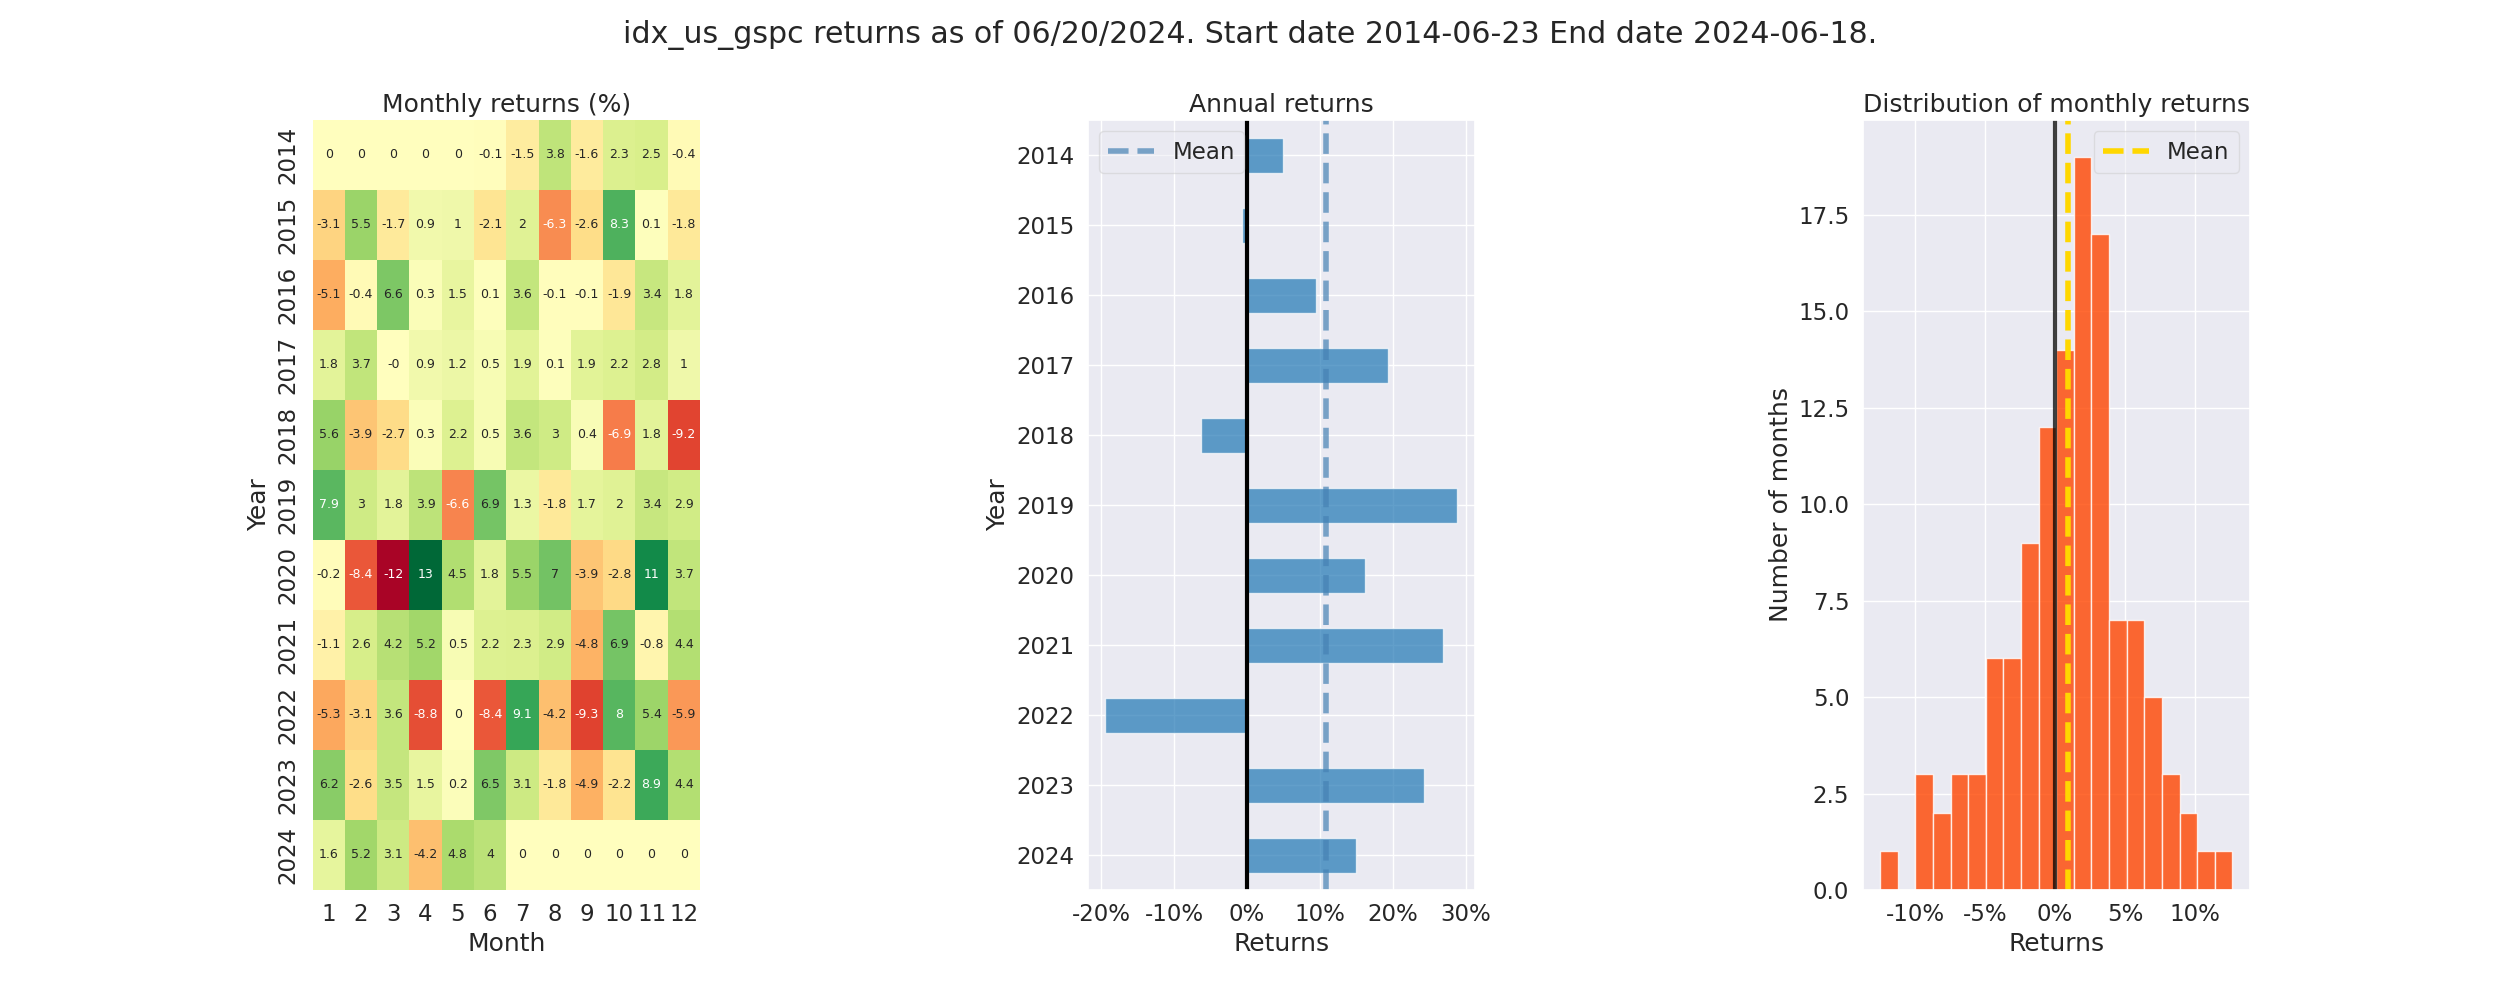
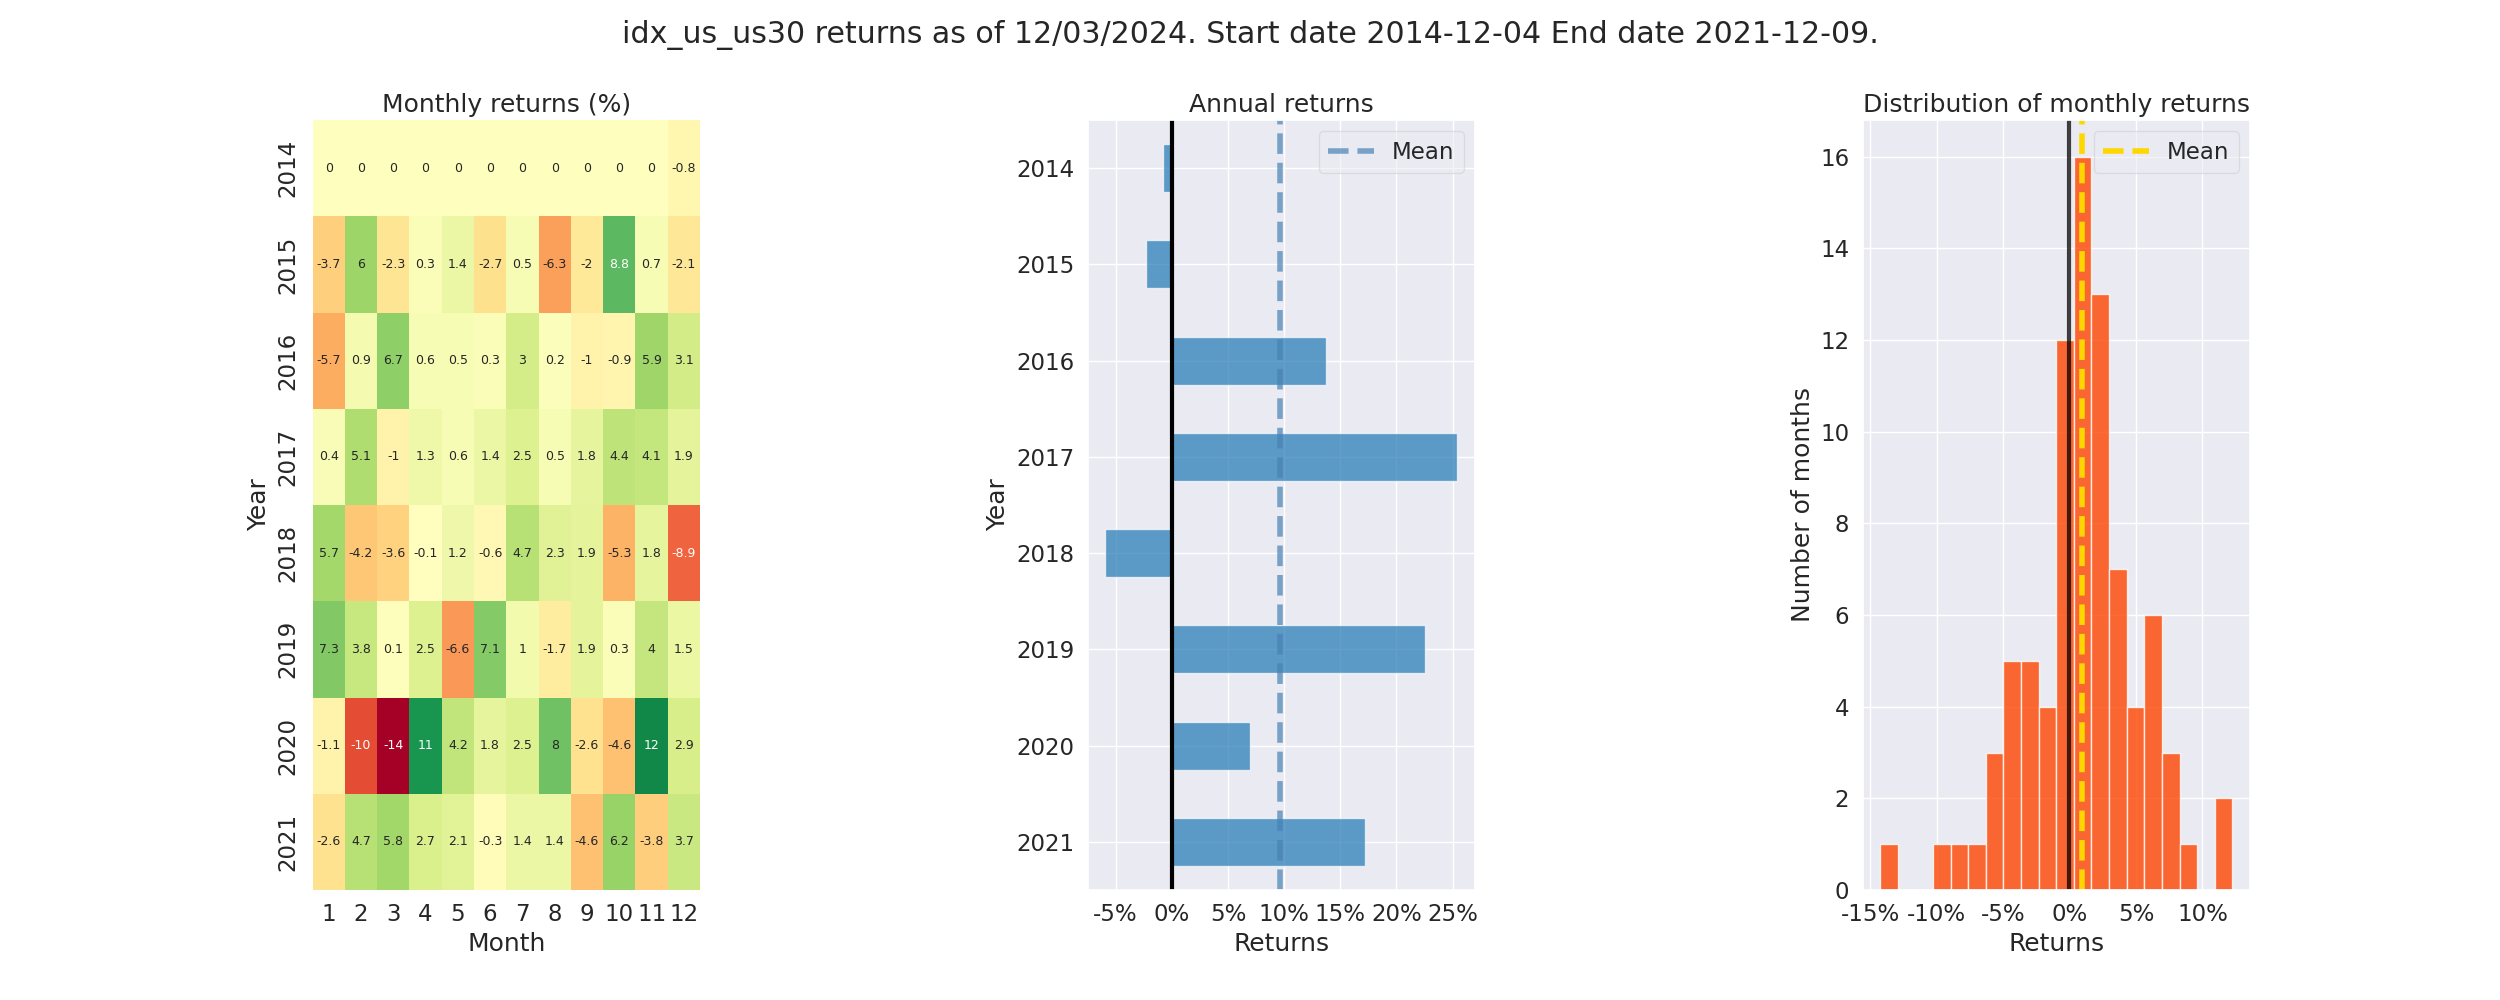
Pyfolio Returns Analysis - Monthly Returns - Indices
Nasdaq 100 Index Monthly Returns
S&P 500 Index Monthly Returns
Dow Jones 30 Index Monthly Returns
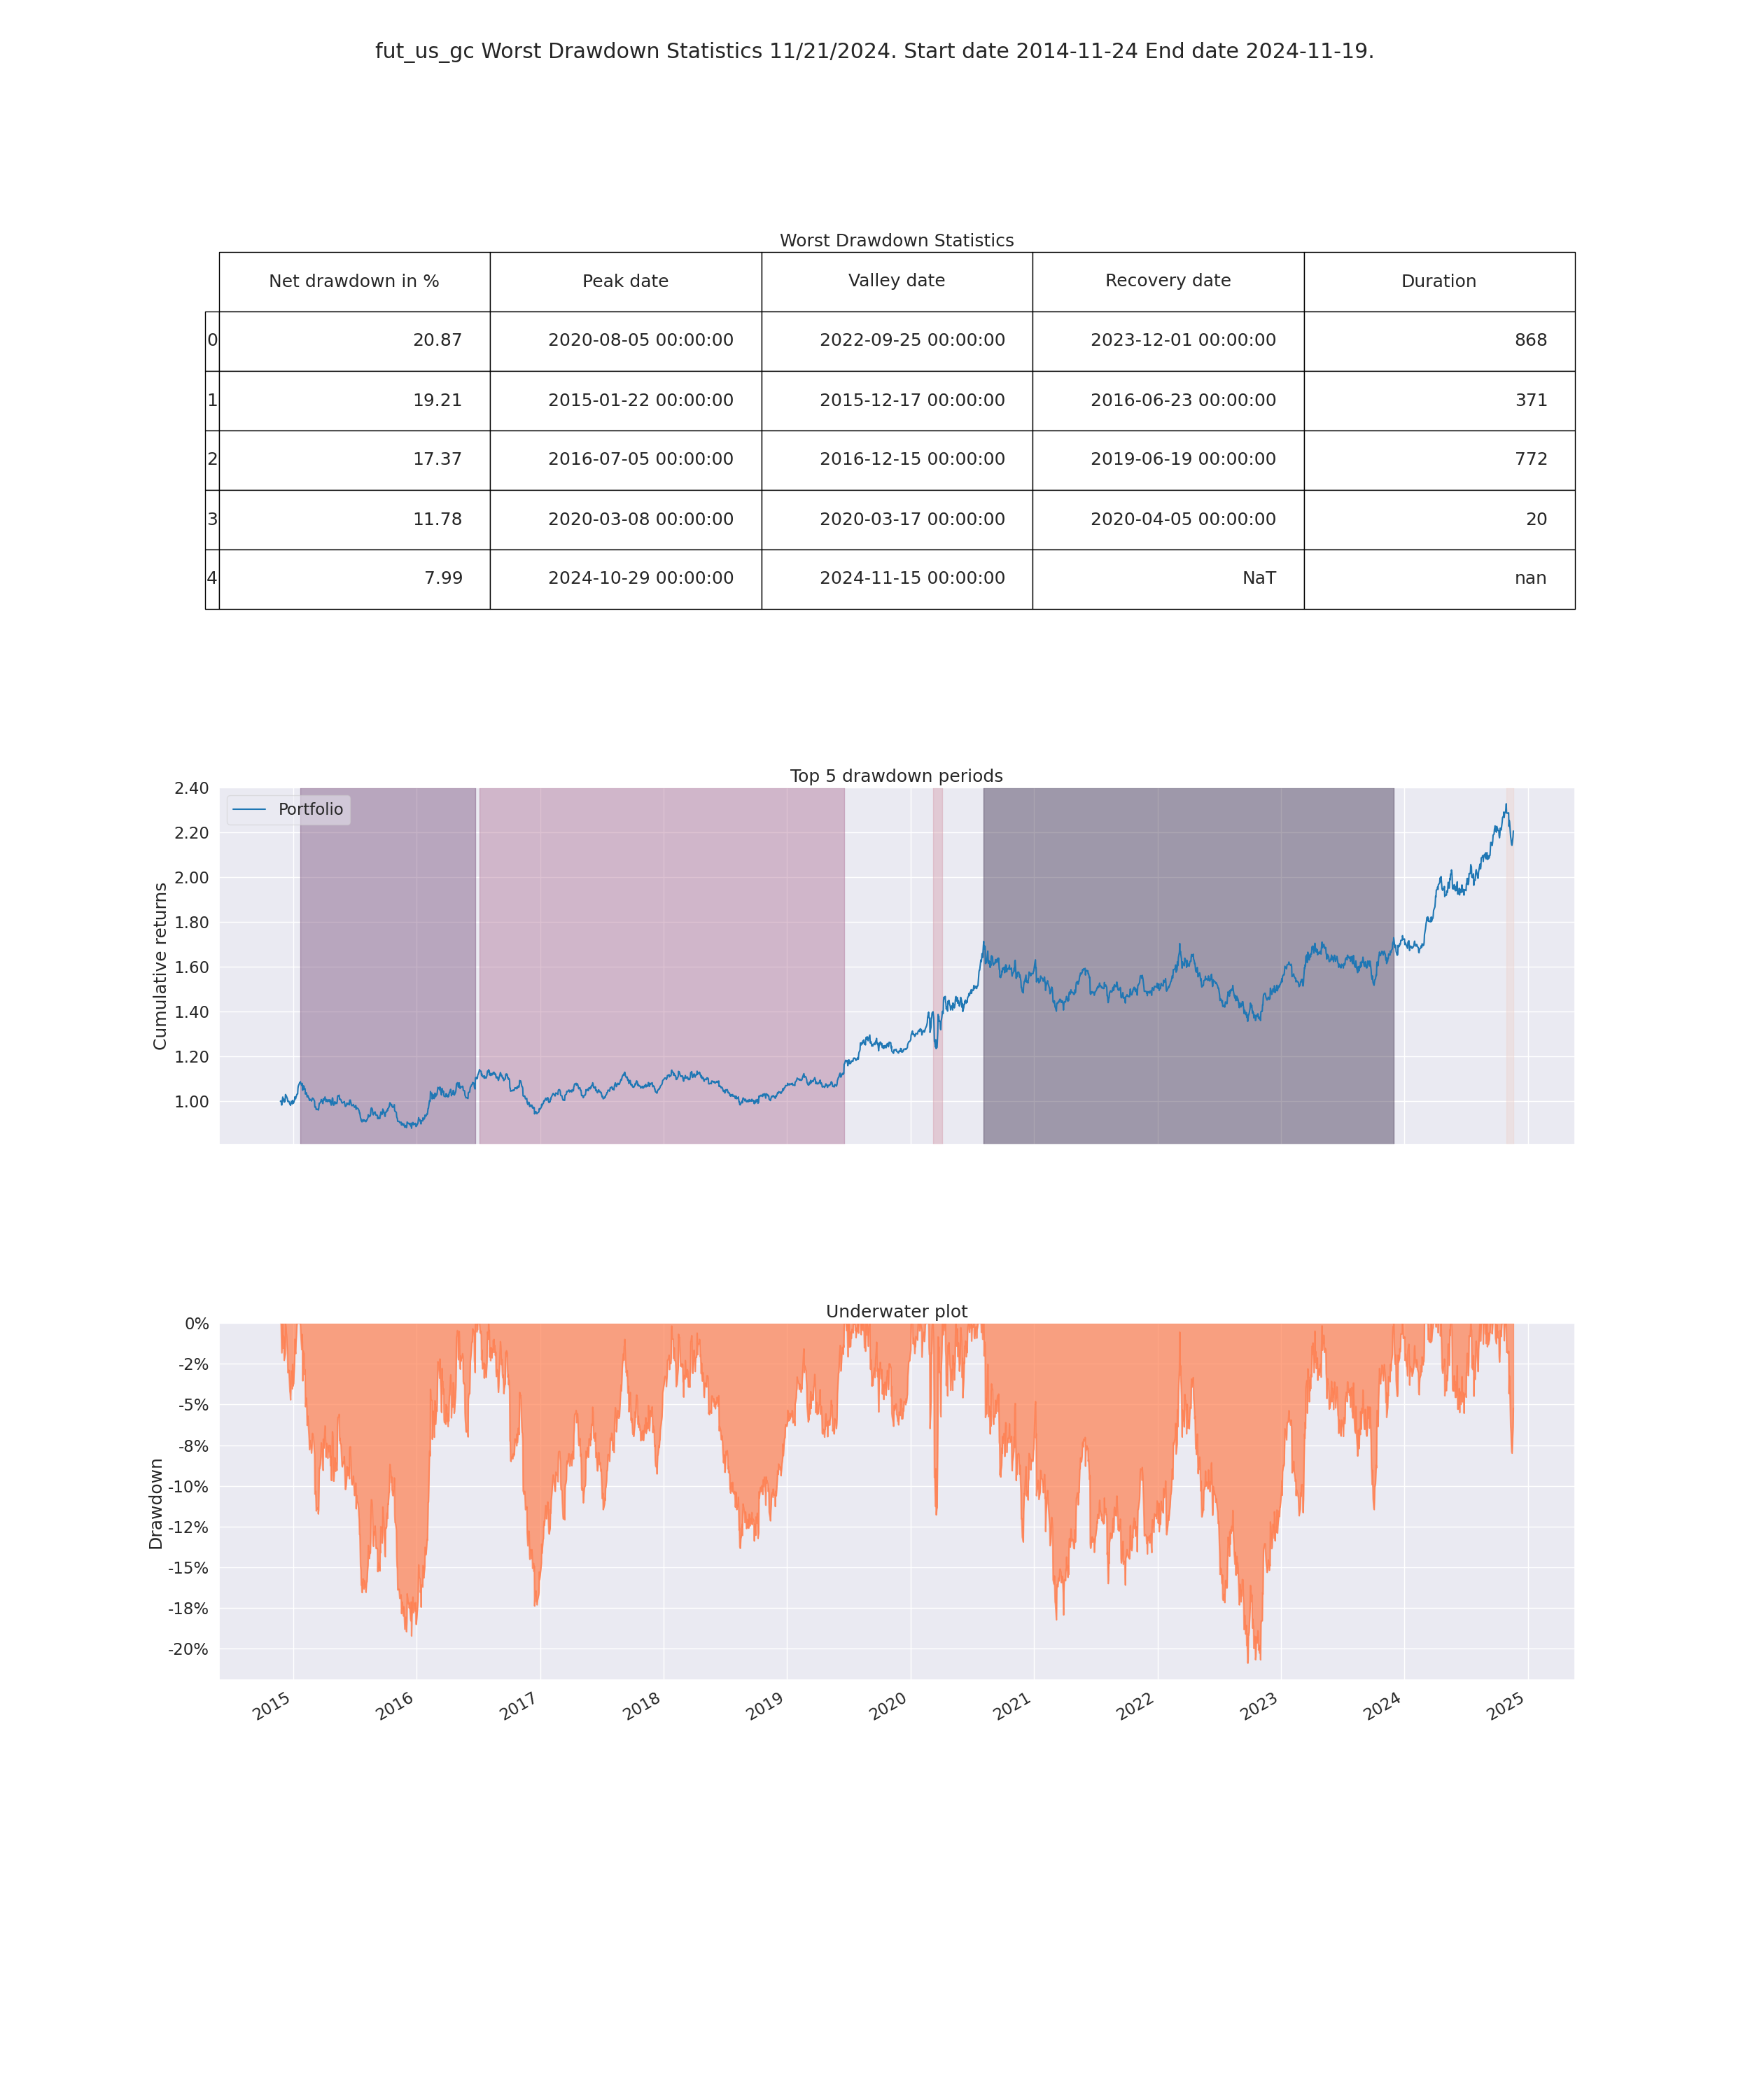
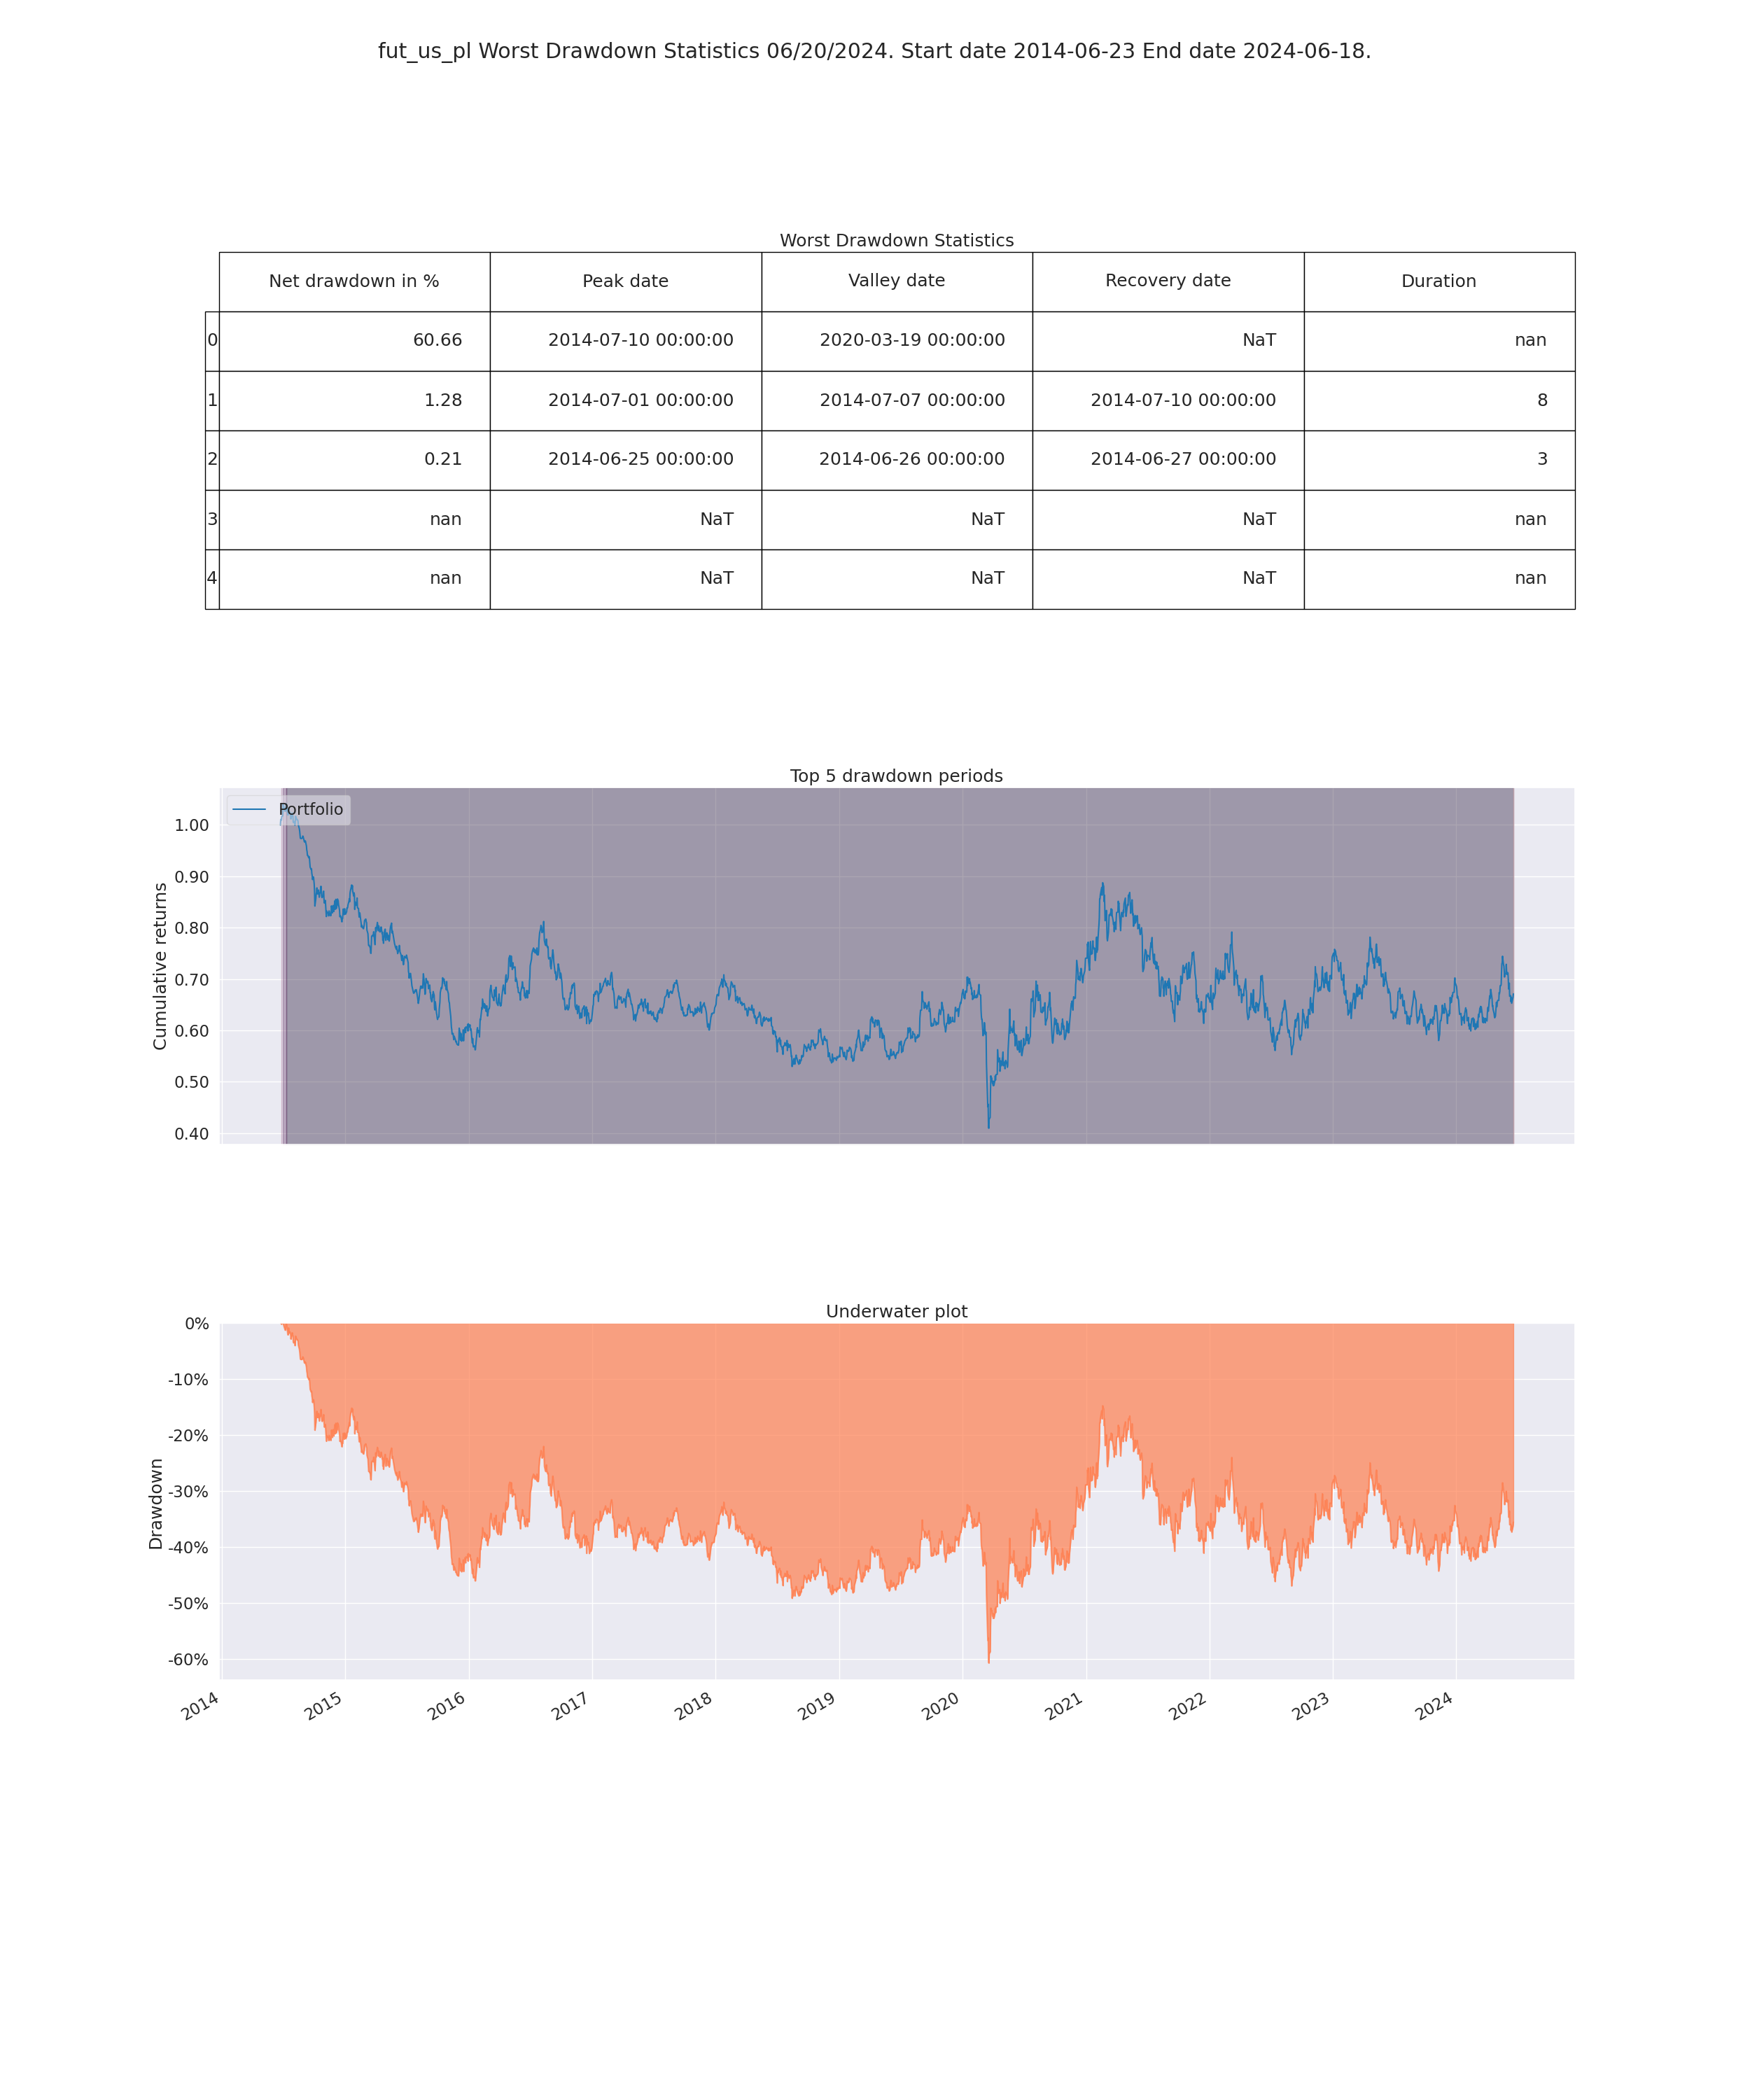
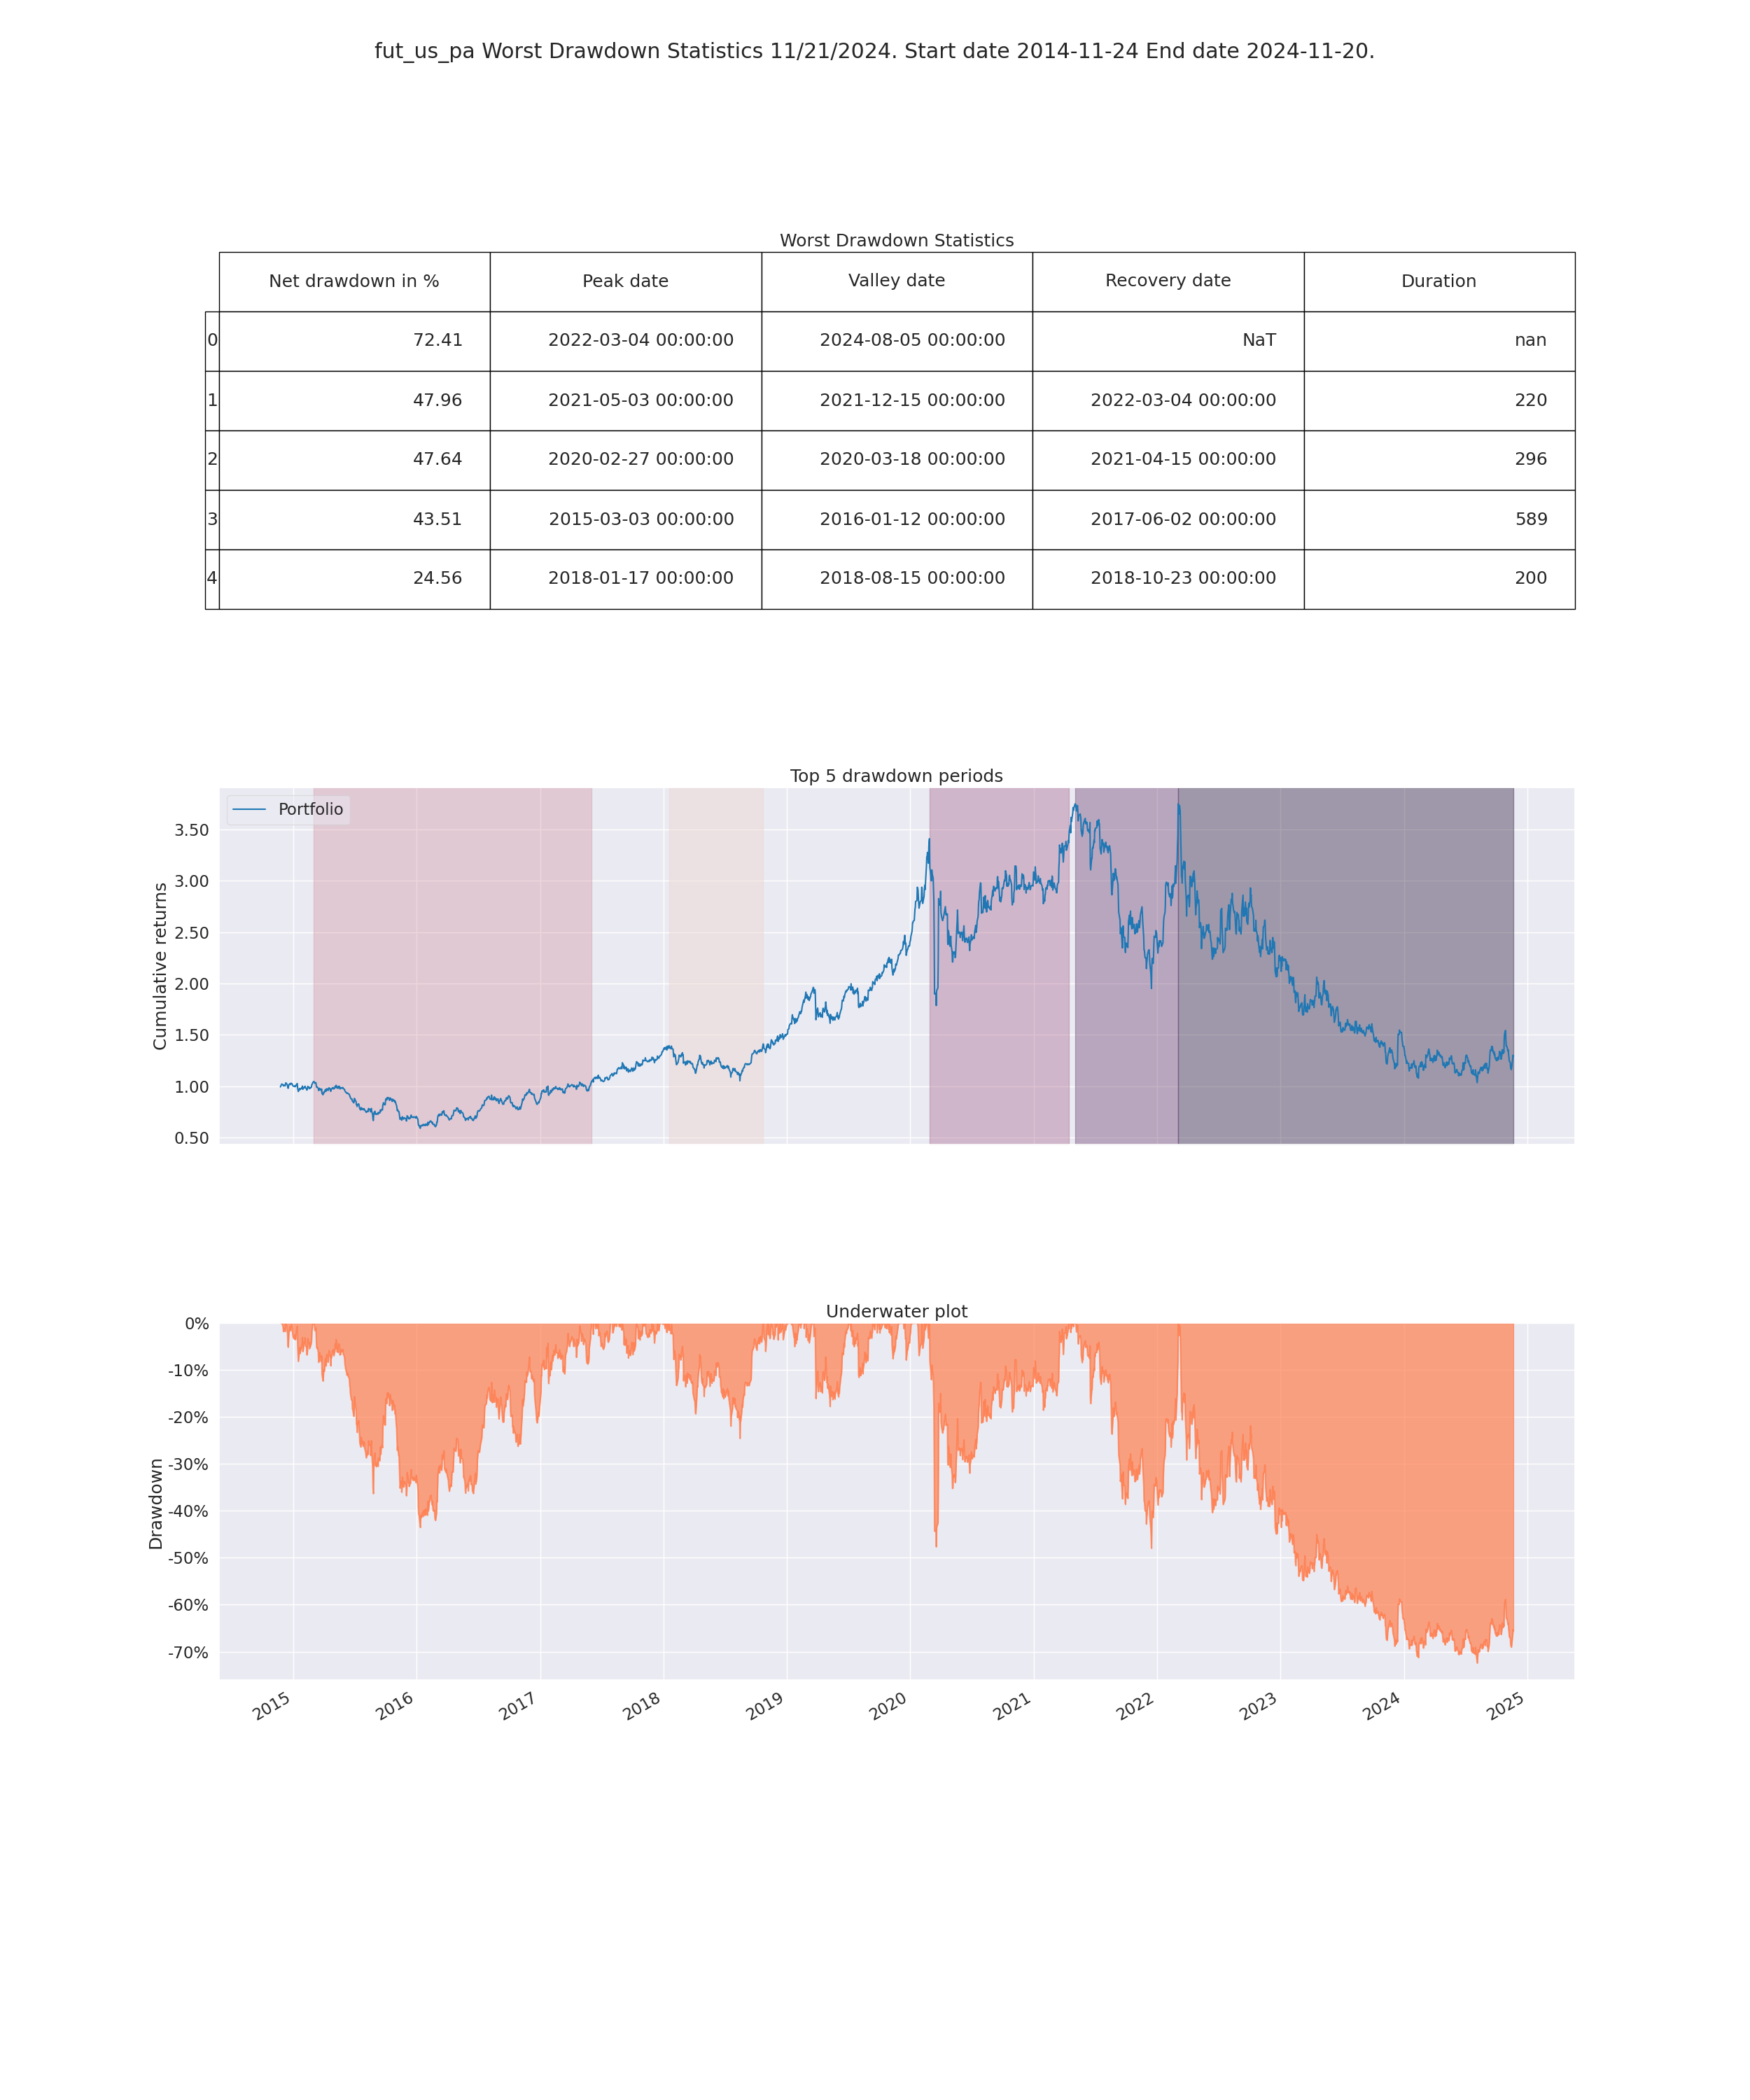
Pyfolio Returns Analysis - Worst Drawdown- Precious Metals
Gold Futures
Platinum Futures
Palladium Futures
Pyfolio Returns Analysis - Worst Drawdown - Indices
Nasdaq 100 Index
S&P 500 Index
Dow Jones 30 Index