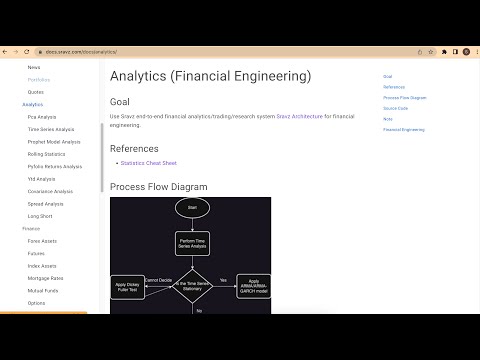
Prophet Model Analysis
Peforms prophet model analysis on assets and portfolios.
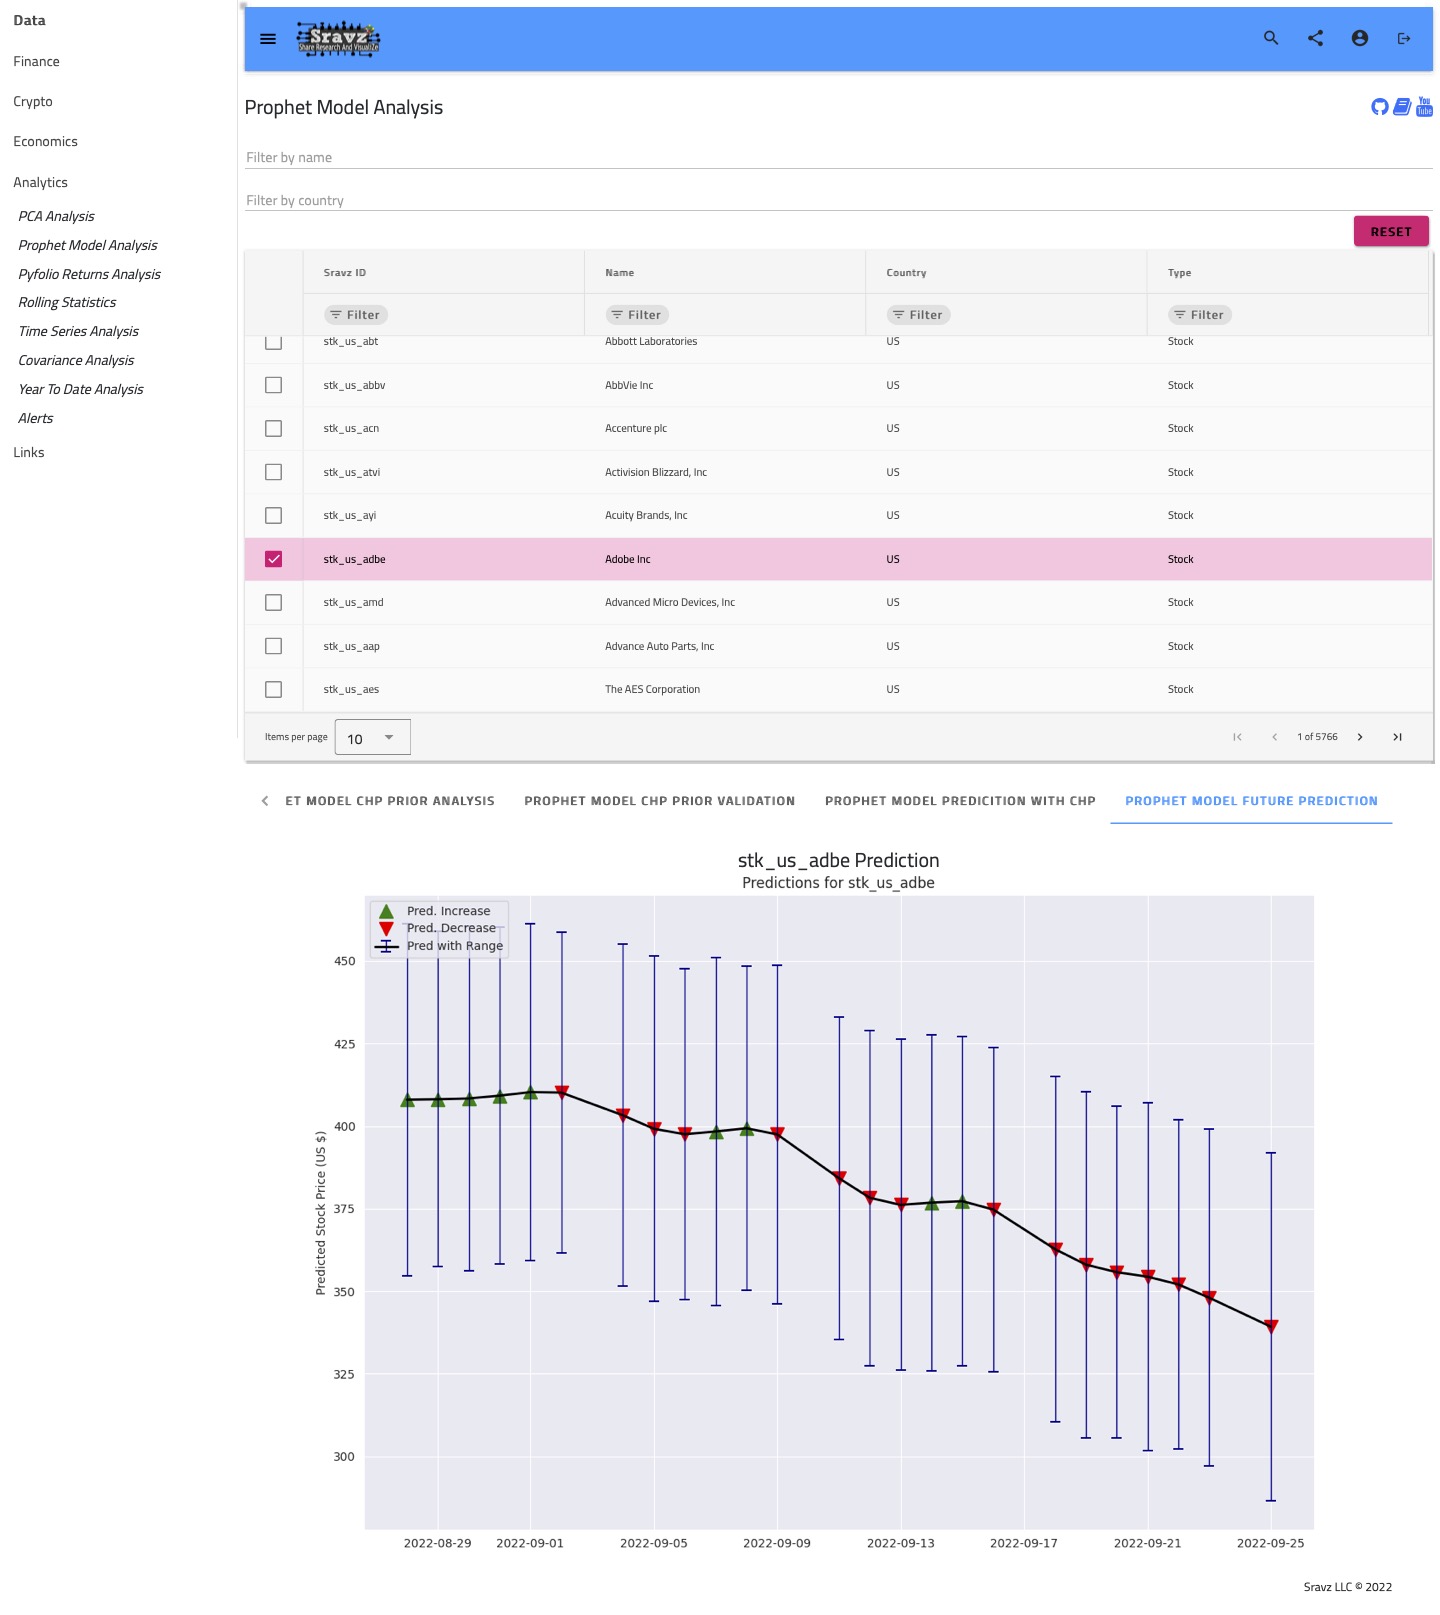
Sravz Prophet Model Analysis - Screenshot
Screenshot:
Use Case
- Predict future asset price
- Tune the model to adjust the weightage on the prior price trends
Prophet Model Description
- Prophet Model Analysis
- Displays asset price prediction 90 days into the future
- Price prediction confidence interval is set to 80%
- confidence interval widens out into the future because future is more uncertain
- Prophet Model Prediction Evaluation
- We use supervised learning i.e model learns the patterns and relationships in the data from the training set and reproduces them for the test data
- Test data is divided into training and test data
- Training data = Used to tune the model
- Test data = To test the model (If there is overfitting/underfitting - how is the prediction?)
- Prediction evaluation provides useful metrics to evaluate the model
- Default parameters (hyperparameters) sometimes require tuning
- Prophet Model CHP Prior Analysis
- Prophet model important setting is changepoint prior scale which controls the amout of weight the model places on shifts in the trend of the data
- The changepoint prior scale represents the amount of emphasis given to the changepoints in the model. This is used to control overfitting vs. underfitting (also known as the bias vs. variance tradeoff).
- Error is calculated use MSE
$$ MSE = \frac{\displaystyle\sum_{i=1}^{n}(y_i - \hat{y_i})^2} {n} $$
where $$y_i$$ is actual observation and $$\hat{y_i}$$ is estimated/modeled observation - Prophet Model CHP Prior Analysis plot the impact of Change Point Prior Analysis graphically
- Change point prior is analysed at 0.001, 0.050, 0.100, 0.200
- Change point has direct relation to fitting.
- Lower change point could result in underfitting, higher changepoint could result in overfitting.
- In this model we choose Changepoint Prior Scale (CPS) of 0.05
- CPS efficiency table displays CPS vs error. We have to use the CPS which reduces error
- Change point prior validation plots display error/uncertainity vs CPS
- CPS has to be selected at which error/uncertainity is the lowest
- CPS Efficienty table displays the impact on CPS on the MSE. All values are in $
- Model is updated with CPS (0.05) and reevaluated (Prediction with change points plot)
- Prediction plot displays future price prediction
Code explanation video