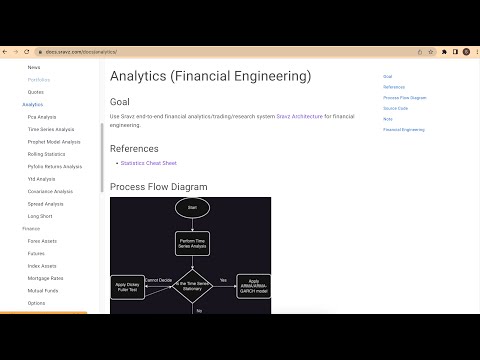
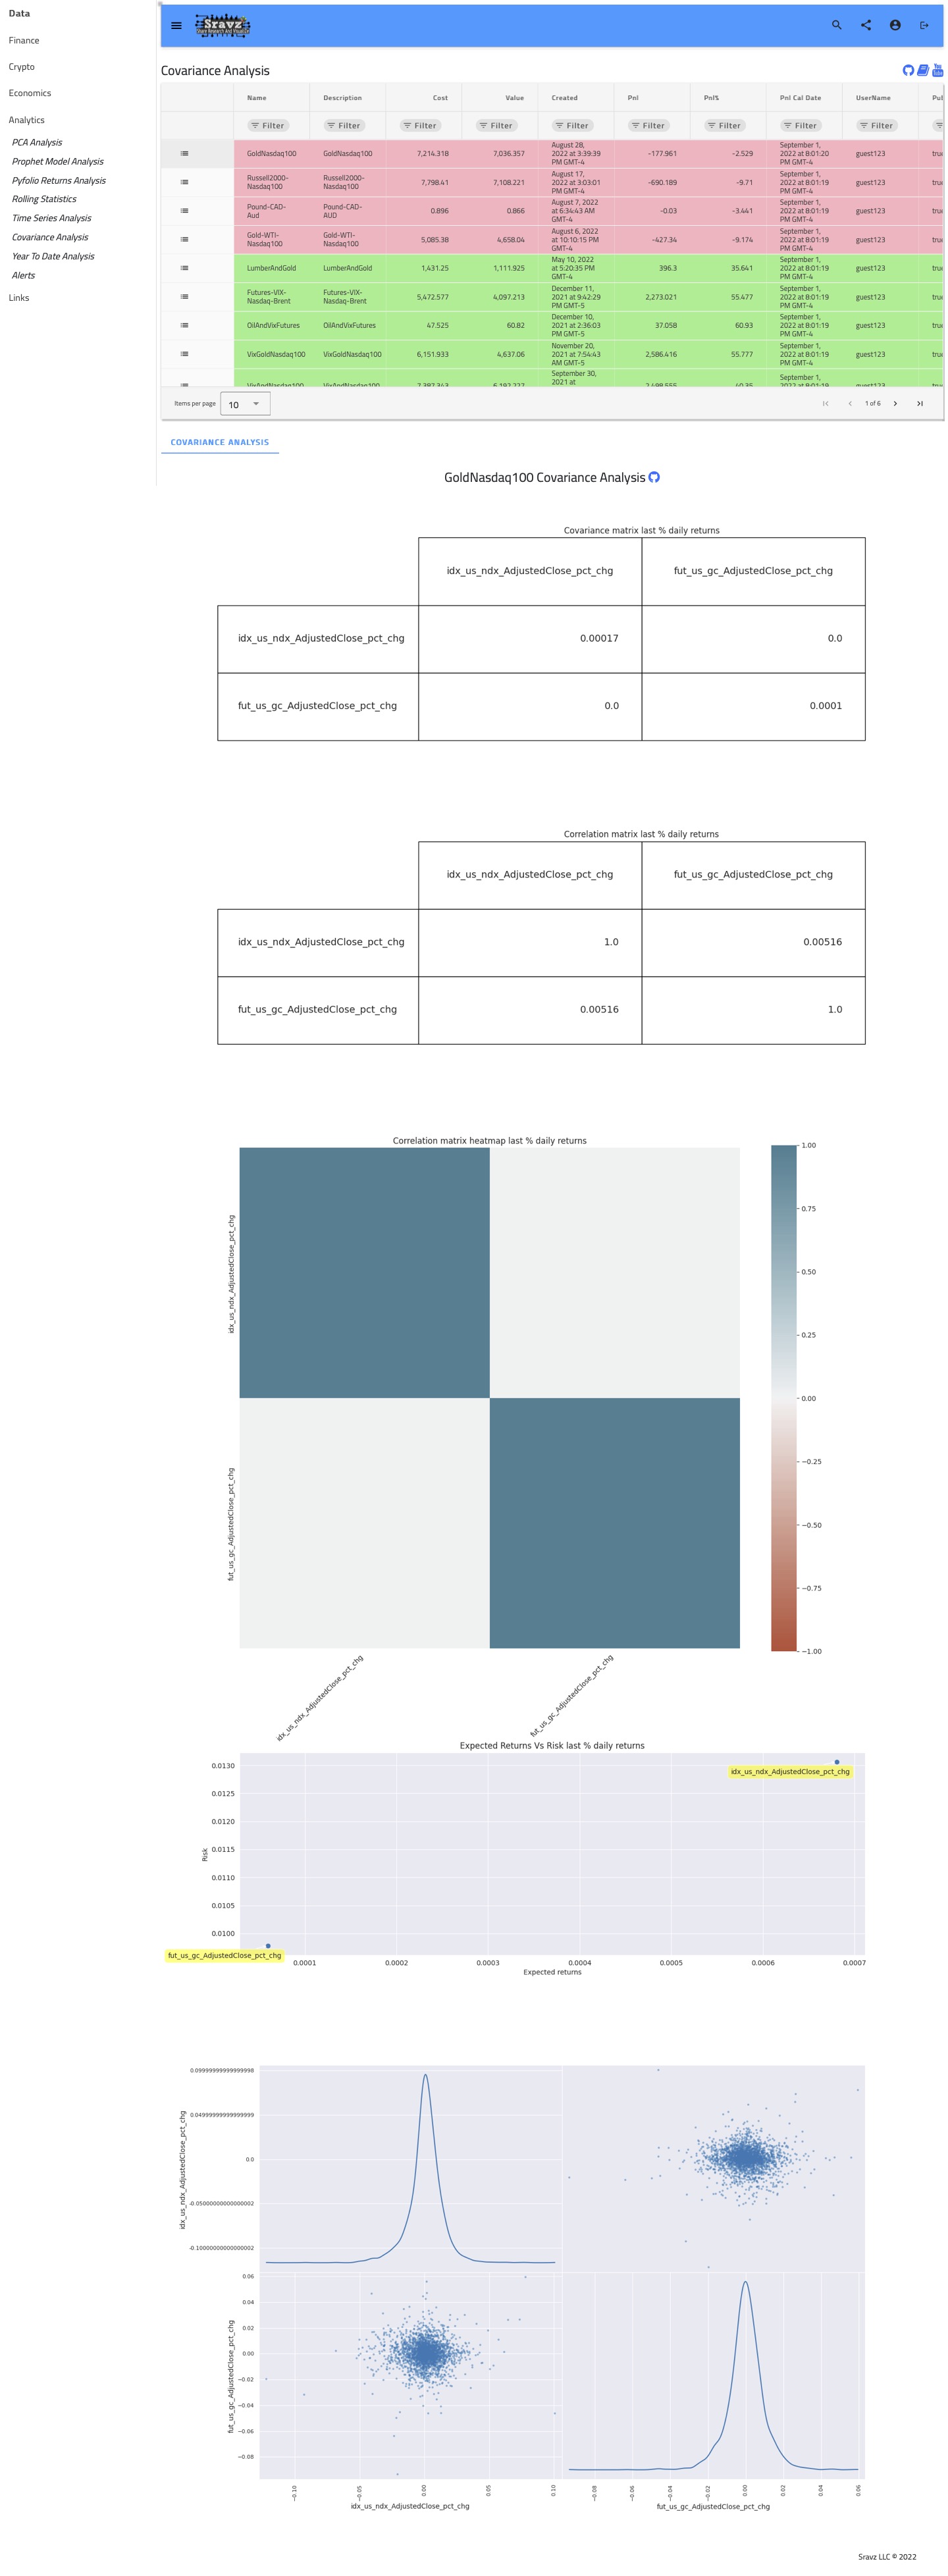
Covariance Analysis
Peforms Covariance Analysis analysis of portfolios.
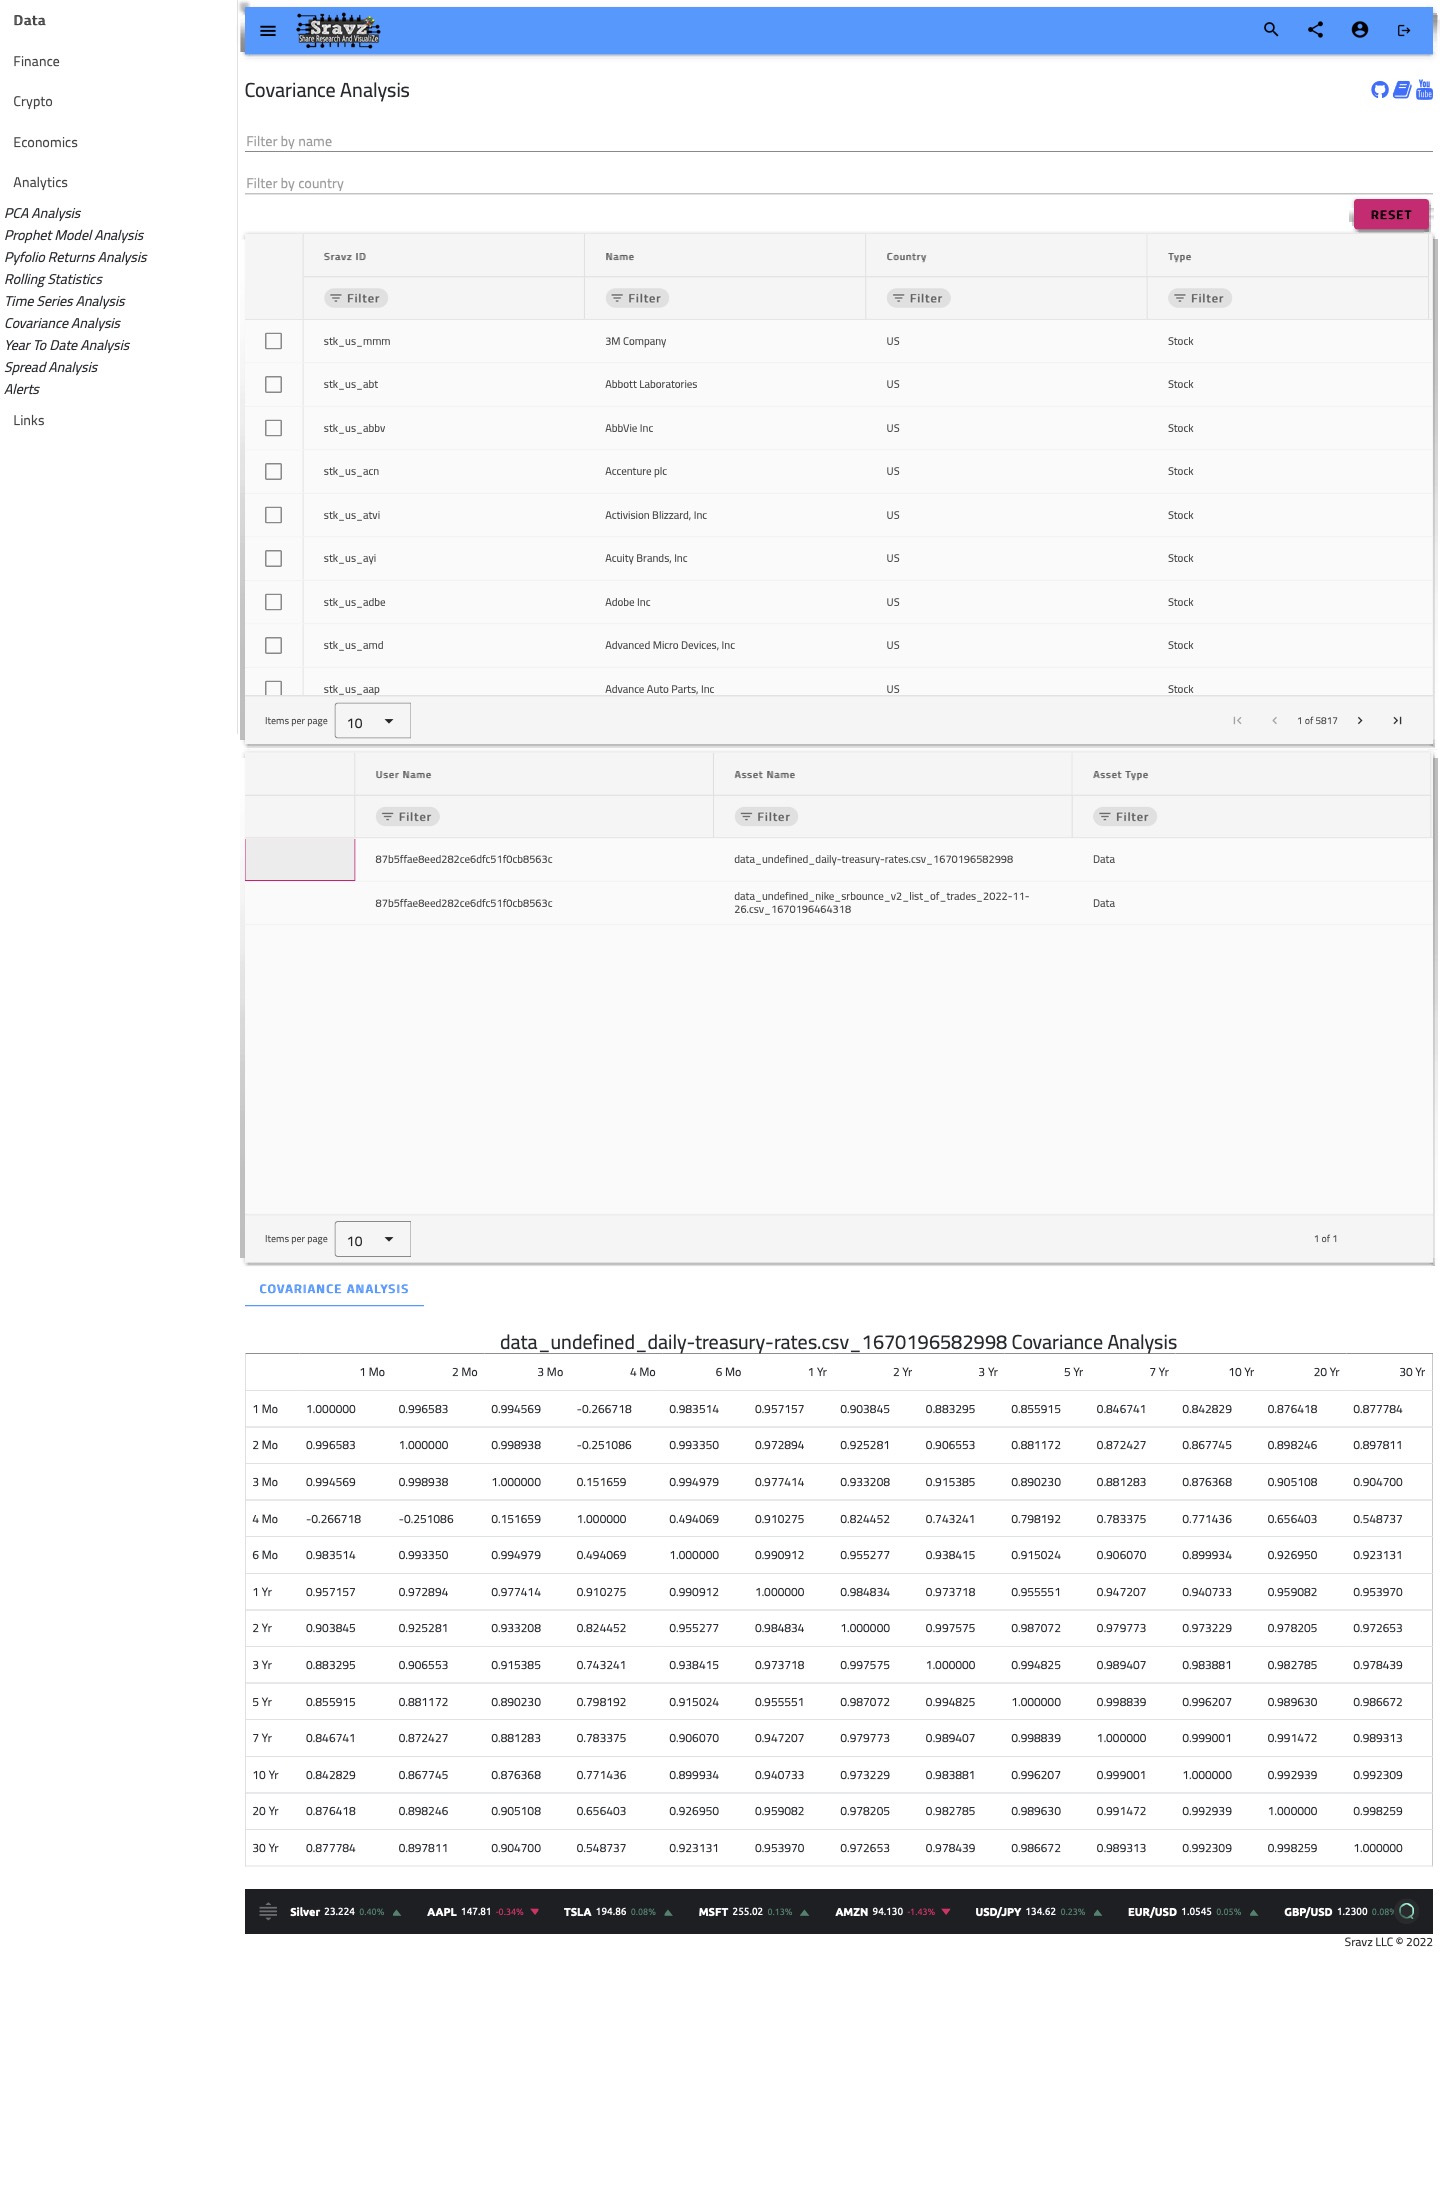
Sravz Covariance Analaysis - Screenshot
- Perform Correlation Analysis of any data.
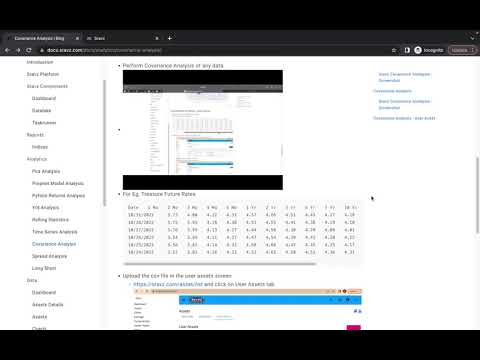
- For Eg: Treasure Future Rates
Date 1 Mo 2 Mo 3 Mo 4 Mo 6 Mo 1 Yr 2 Yr 3 Yr 5 Yr 7 Yr 10 Yr 20 Yr 30 Yr 10/31/2022 3.73 4.00 4.22 4.33 4.57 4.66 4.51 4.45 4.27 4.18 4.10 4.44 4.22 10/28/2022 3.75 3.95 4.18 4.30 4.51 4.55 4.41 4.38 4.19 4.10 4.02 4.38 4.15 10/27/2022 3.76 3.95 4.13 4.27 4.44 4.50 4.30 4.29 4.09 4.01 3.96 4.32 4.12 10/26/2022 3.54 3.85 4.11 4.27 4.47 4.54 4.39 4.41 4.20 4.12 4.04 4.38 4.19 10/25/2022 3.56 3.81 4.14 4.32 4.50 4.60 4.42 4.45 4.25 4.17 4.10 4.45 4.26 10/24/2022 3.57 3.83 4.16 4.33 4.52 4.61 4.50 4.52 4.36 4.31 4.25 4.59 4.40 - Upload the csv file in the user assets screen
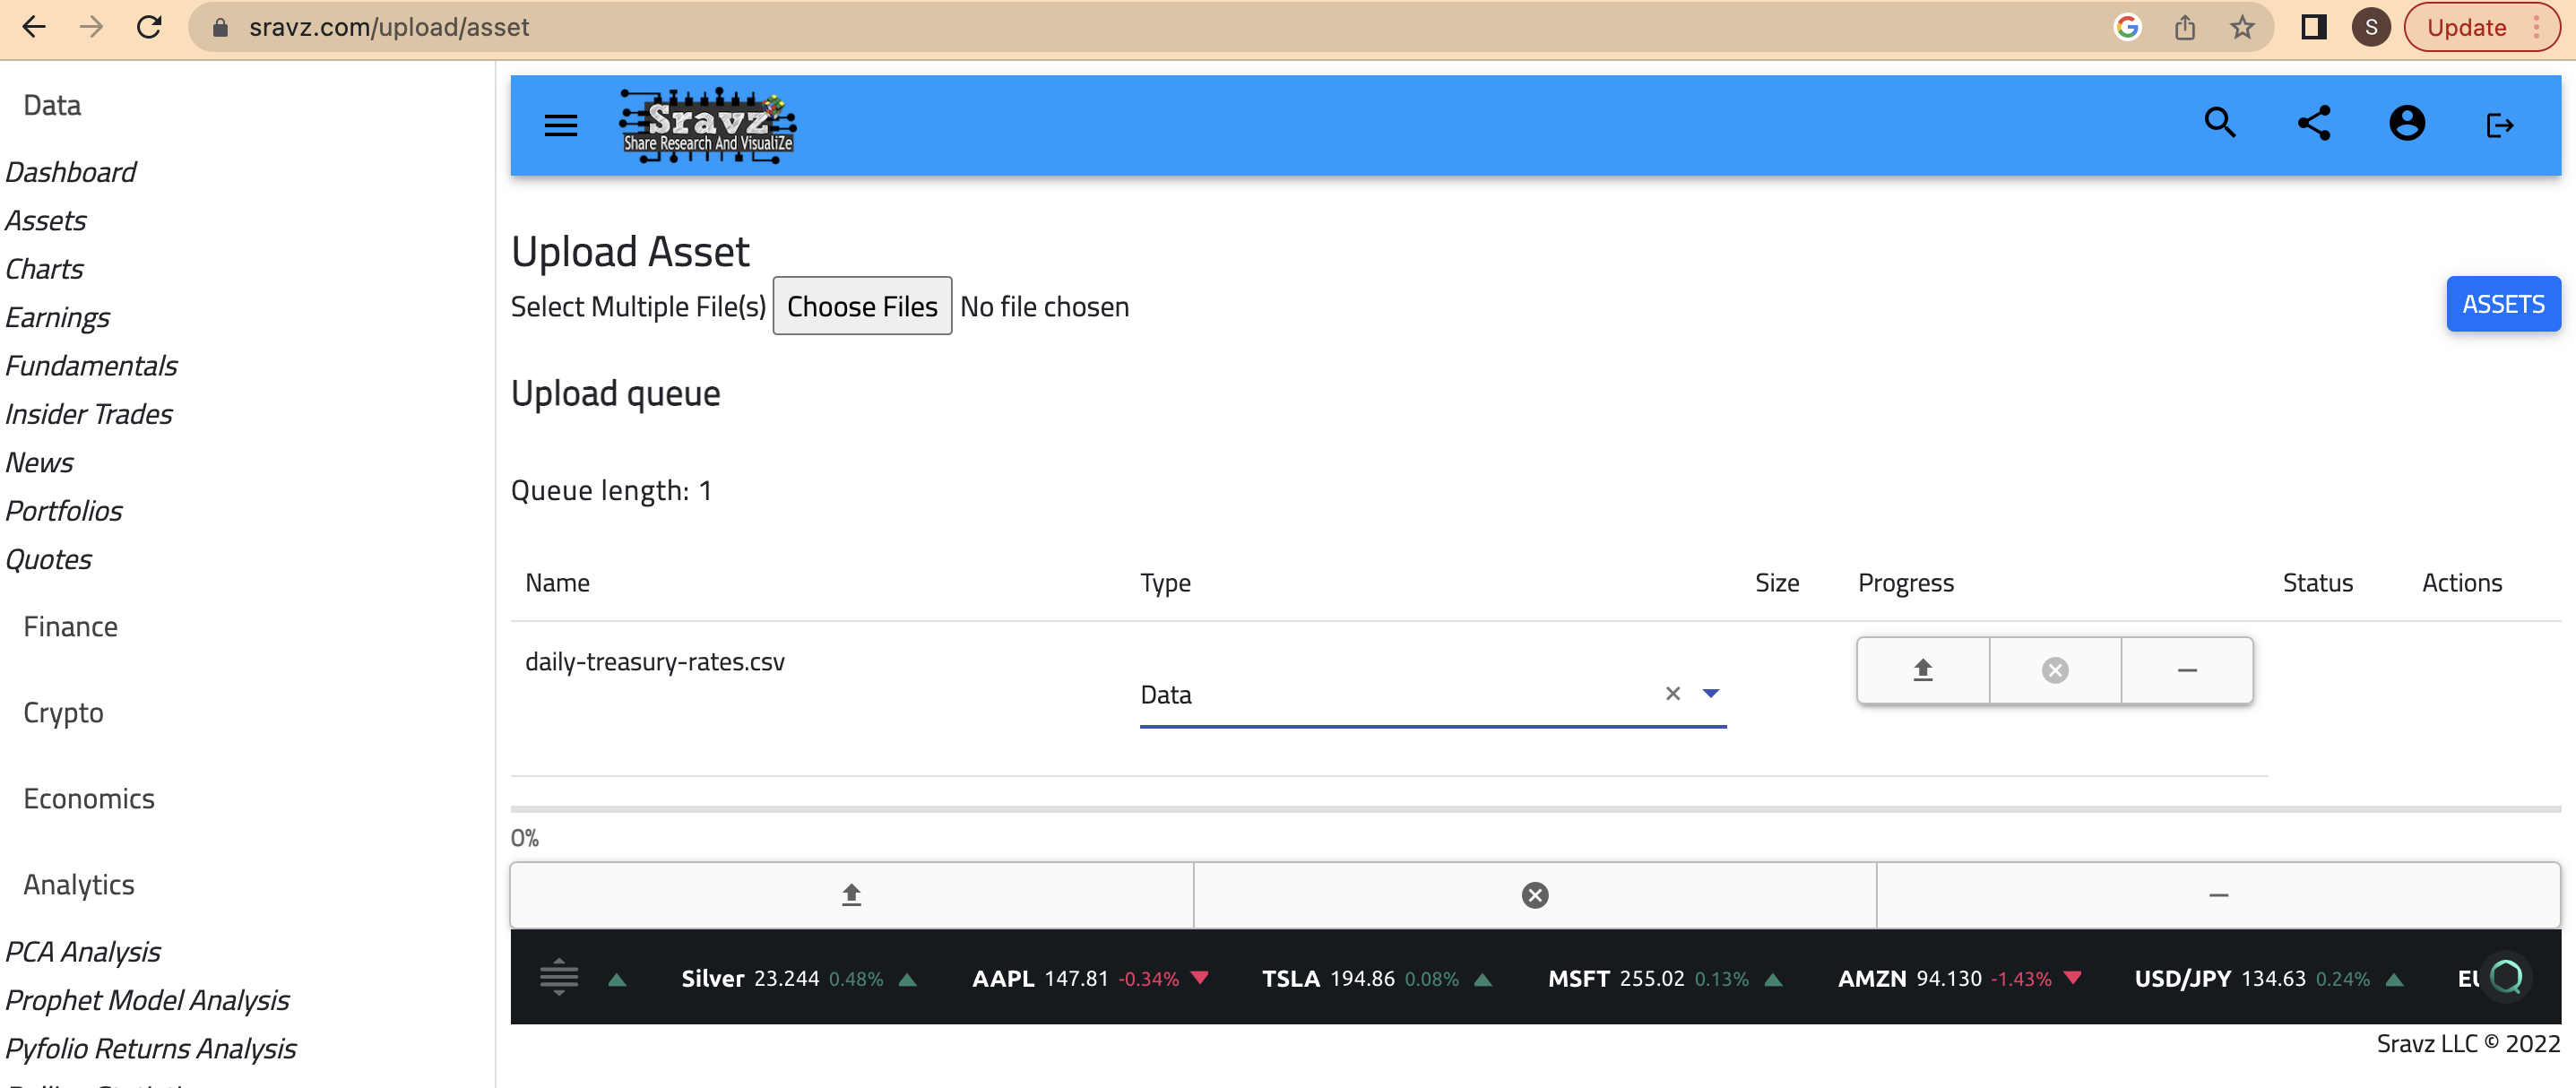
- https://sravz.com/asset/list and click on User Assets tab
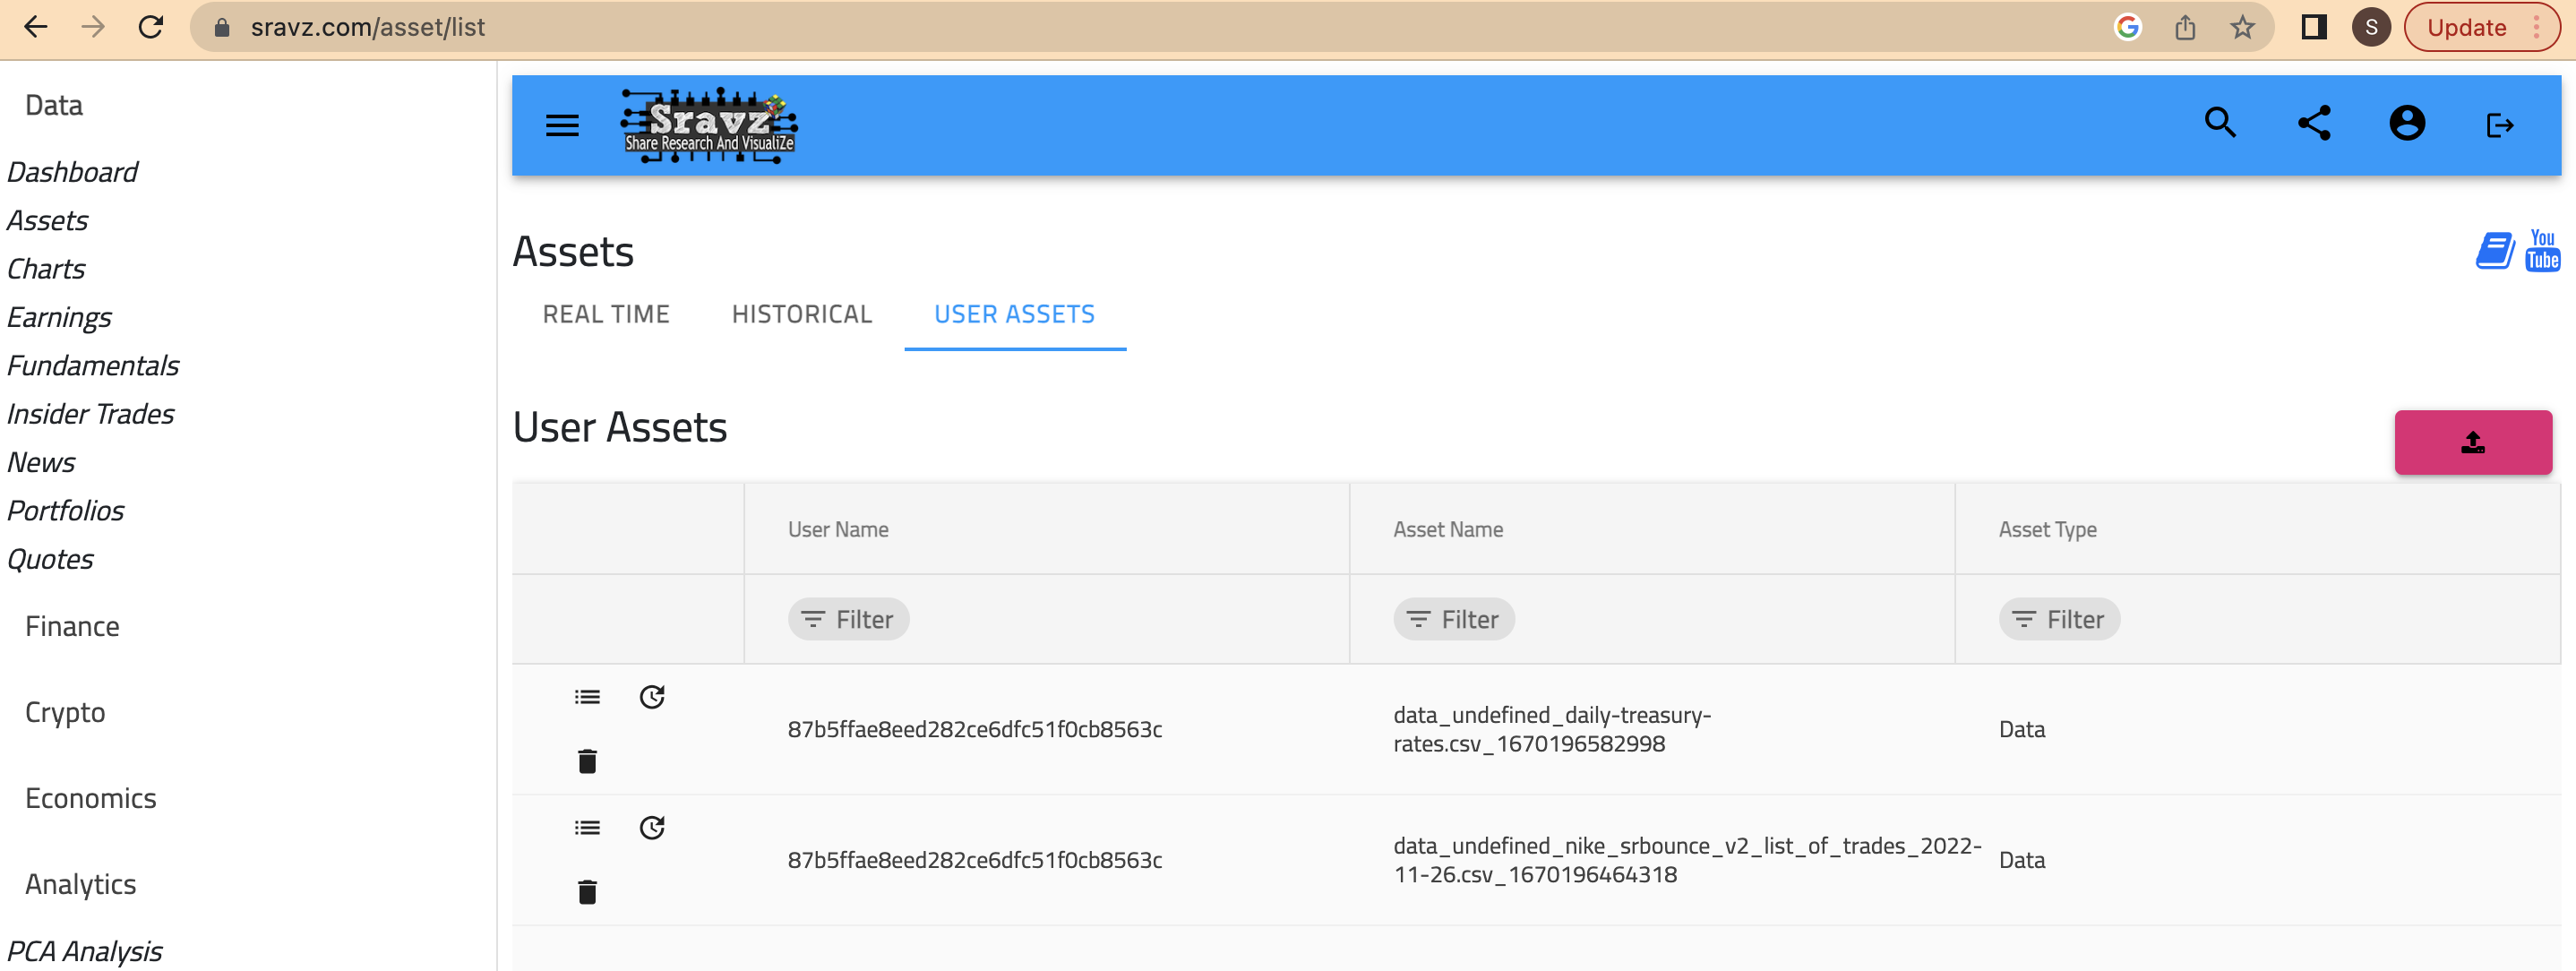
- Upload single or multple CSV files
- Select data in asset type drop down
- Select the uploaded asset in the Analytics -> Covariance Analysis Page
Use Case
Covariance matrix
- Displays covariance matrix of AdjustedClose daily % returns
- Statistical measure of the directional relationship between two asset returns
- Positive covariance imply assets move in same direction negative covariance imply assets move in opposite direction
- Defines the spread (variance) and the orientation (covariance) of the dataset
- Variance of single random variable:
$$ \sigma^2_x = \frac{1}{n-1} \sum^{n}_{i=1}(x_i – \bar{x})^2 \\ $$
- Covariance of two random variable:
$$ \sigma(x, y) = \frac{1}{n-1} \sum^{n}_{i=1}{(x_i-\bar{x})(y_i-\bar{y})} $$
- Covariance Matrix calculation:
$$ C = \frac{1}{n-1} \sum^{n}_{i=1}{(X_i-\bar{X})(X_i-\bar{X})^T} $$
- Two dimentional covariance matrix:
$$ C = \left( \begin{array}{ccc} \sigma(x, x) & \sigma(x, y) \\ \sigma(y, x) & \sigma(y, y) \end{array} \right) $$
- If Covariance Matrix is an identity matrix then the portfolio is a white noise i.e the portfolio assets are uncorrelated/independent
$$ \bar{x} = \bar{y} = 0 $$
$$ \sigma^2_x = \sigma^2_y = 1 $$
Correlation matrix
- Displays correation matrix of AdjustedClose daily % returns
- Correlation shows the strengh of the relationship
- Higher the correlation higher the strength
- The correlation will always have a measurement value between -1 and 1, and it adds a strength value on how the stocks move together
- Correlation value:
- 1: Strong move in the same direction
- -1: Strong move in the opposite direction
- 0: Move randomly
Expected Returns Vs Risk (std)
- Displays mean daily returns vs mean daily returns std
Daily returns scatter plot
- Daily returns are centered around 0
- There is lower occurence of high daily gain/loss
Code explanation video